Free US Video Ad Revenue by Industry from 2015 to 2025 Chart
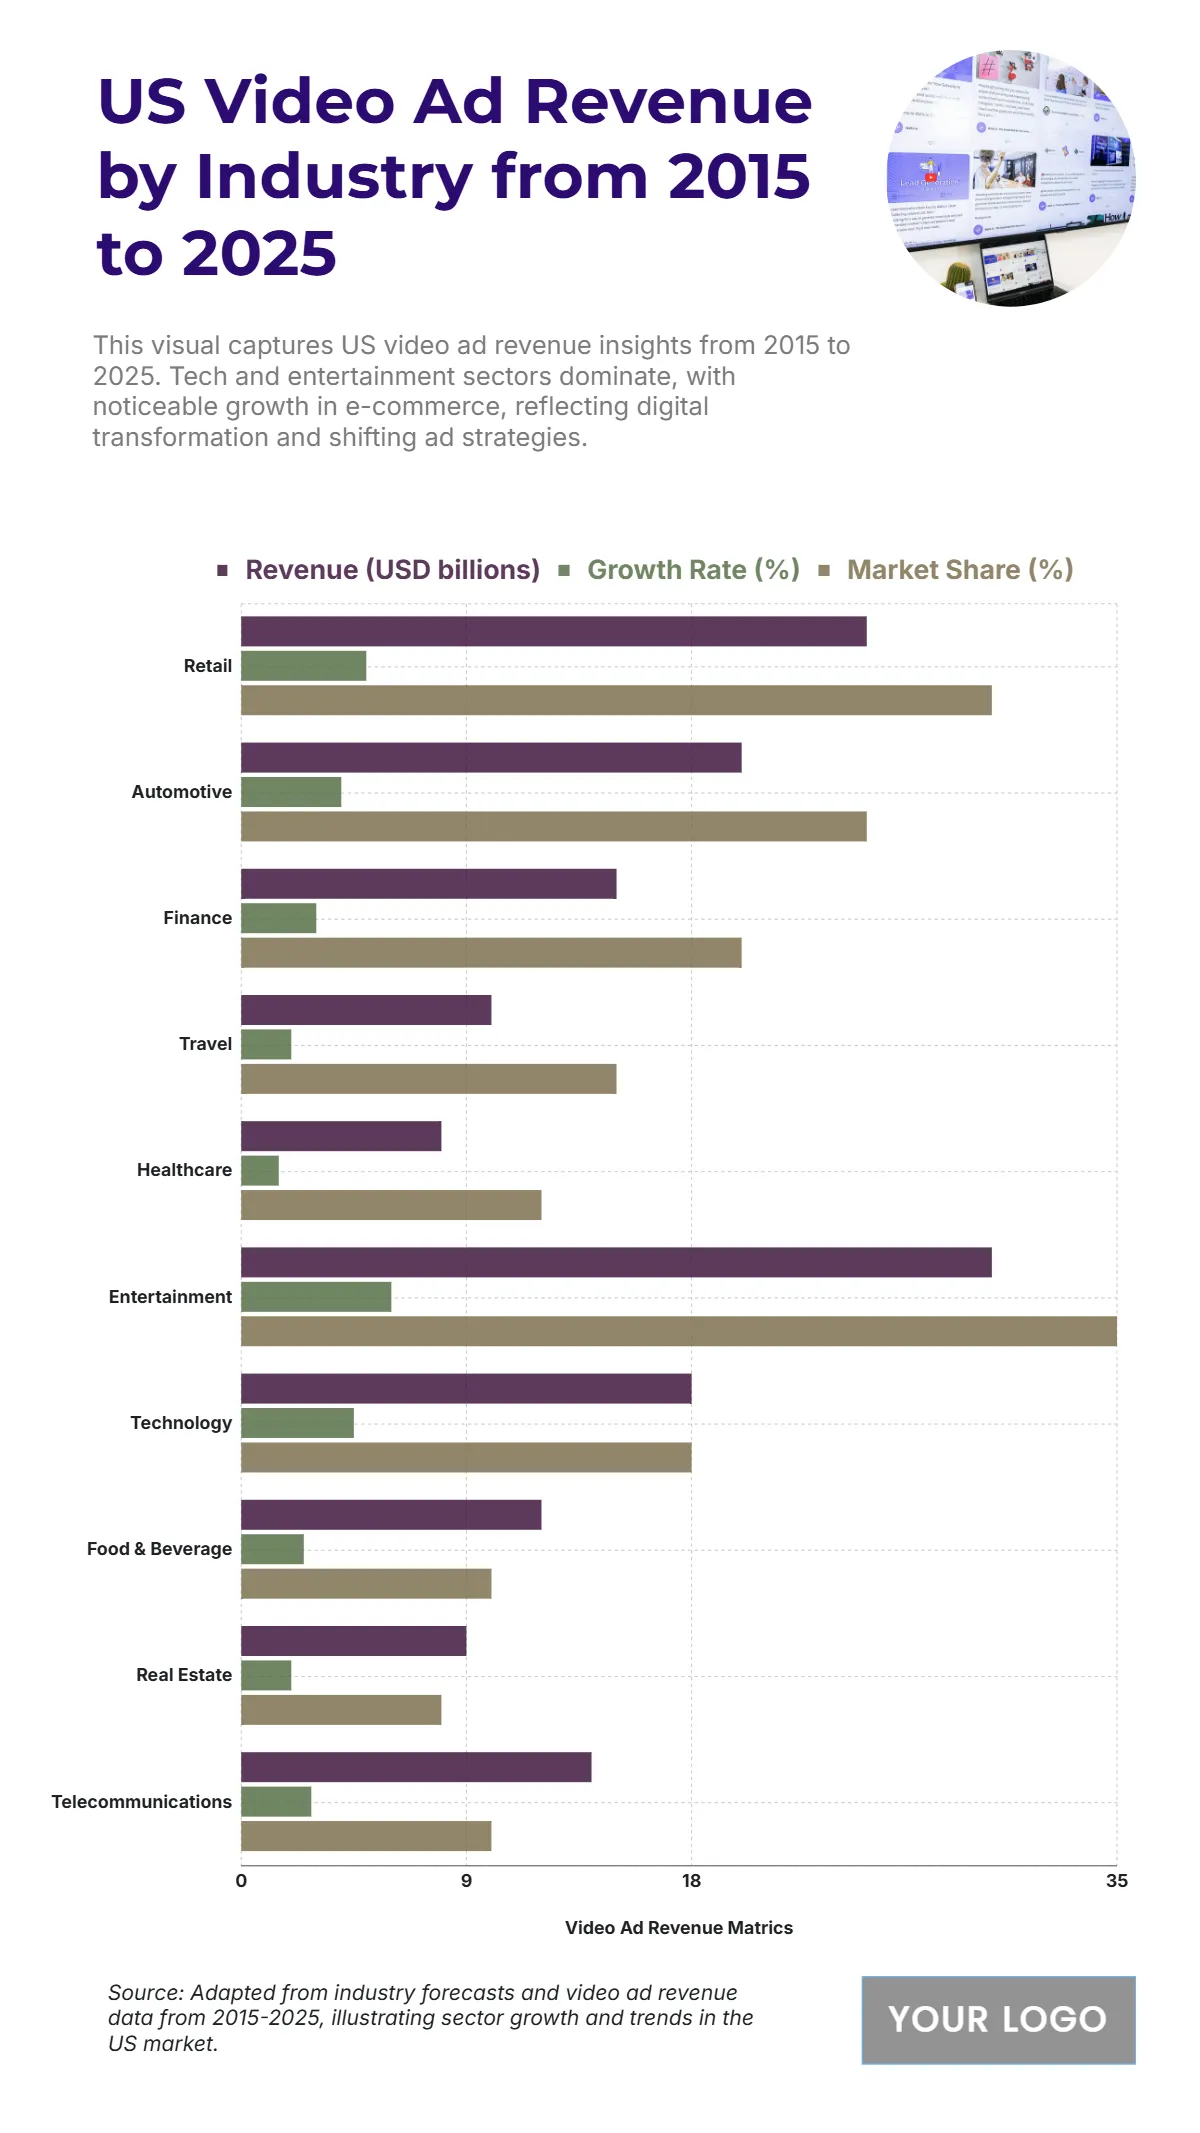
The chart breaks down US video advertising revenue by sector, revealing industry-specific contributions to the growing digital video market. Entertainment leads with USD 30 billion in revenue, a 6% growth rate, and 35% market share, driven by streaming dominance and content marketing. Retail follows with USD 25 billion and 5% growth, leveraging shoppable videos and omnichannel campaigns. The automotive industry contributes USD 20 billion and 25% market share, reflecting consistent brand visibility efforts. Finance, telecommunications, and technology sectors follow closely, with revenues ranging from USD 15 to 18 billion, showcasing reliance on video to communicate complex products. Healthcare and travel remain moderate, earning USD 8 billion and USD 10 billion, respectively, with steady expansion into educational and experiential video content. The overall trend illustrates that video advertising has become a core channel across industries, merging storytelling and brand recall with measurable engagement performance.
| Industry | Revenue (USD billions) | Growth Rate (%) | Market Share (%) |
|---|---|---|---|
| Retail | 25 | 5 | 30 |
| Automotive | 20 | 4 | 25 |
| Finance | 15 | 3 | 20 |
| Travel | 10 | 2 | 15 |
| Healthcare | 8 | 1.5 | 12 |
| Entertainment | 30 | 6 | 35 |
| Technology | 18 | 4.5 | 18 |
| Food & Beverage | 12 | 2.5 | 10 |
| Real Estate | 9 | 2 | 8 |
| Telecommunications | 14 | 2.8 | 10 |


