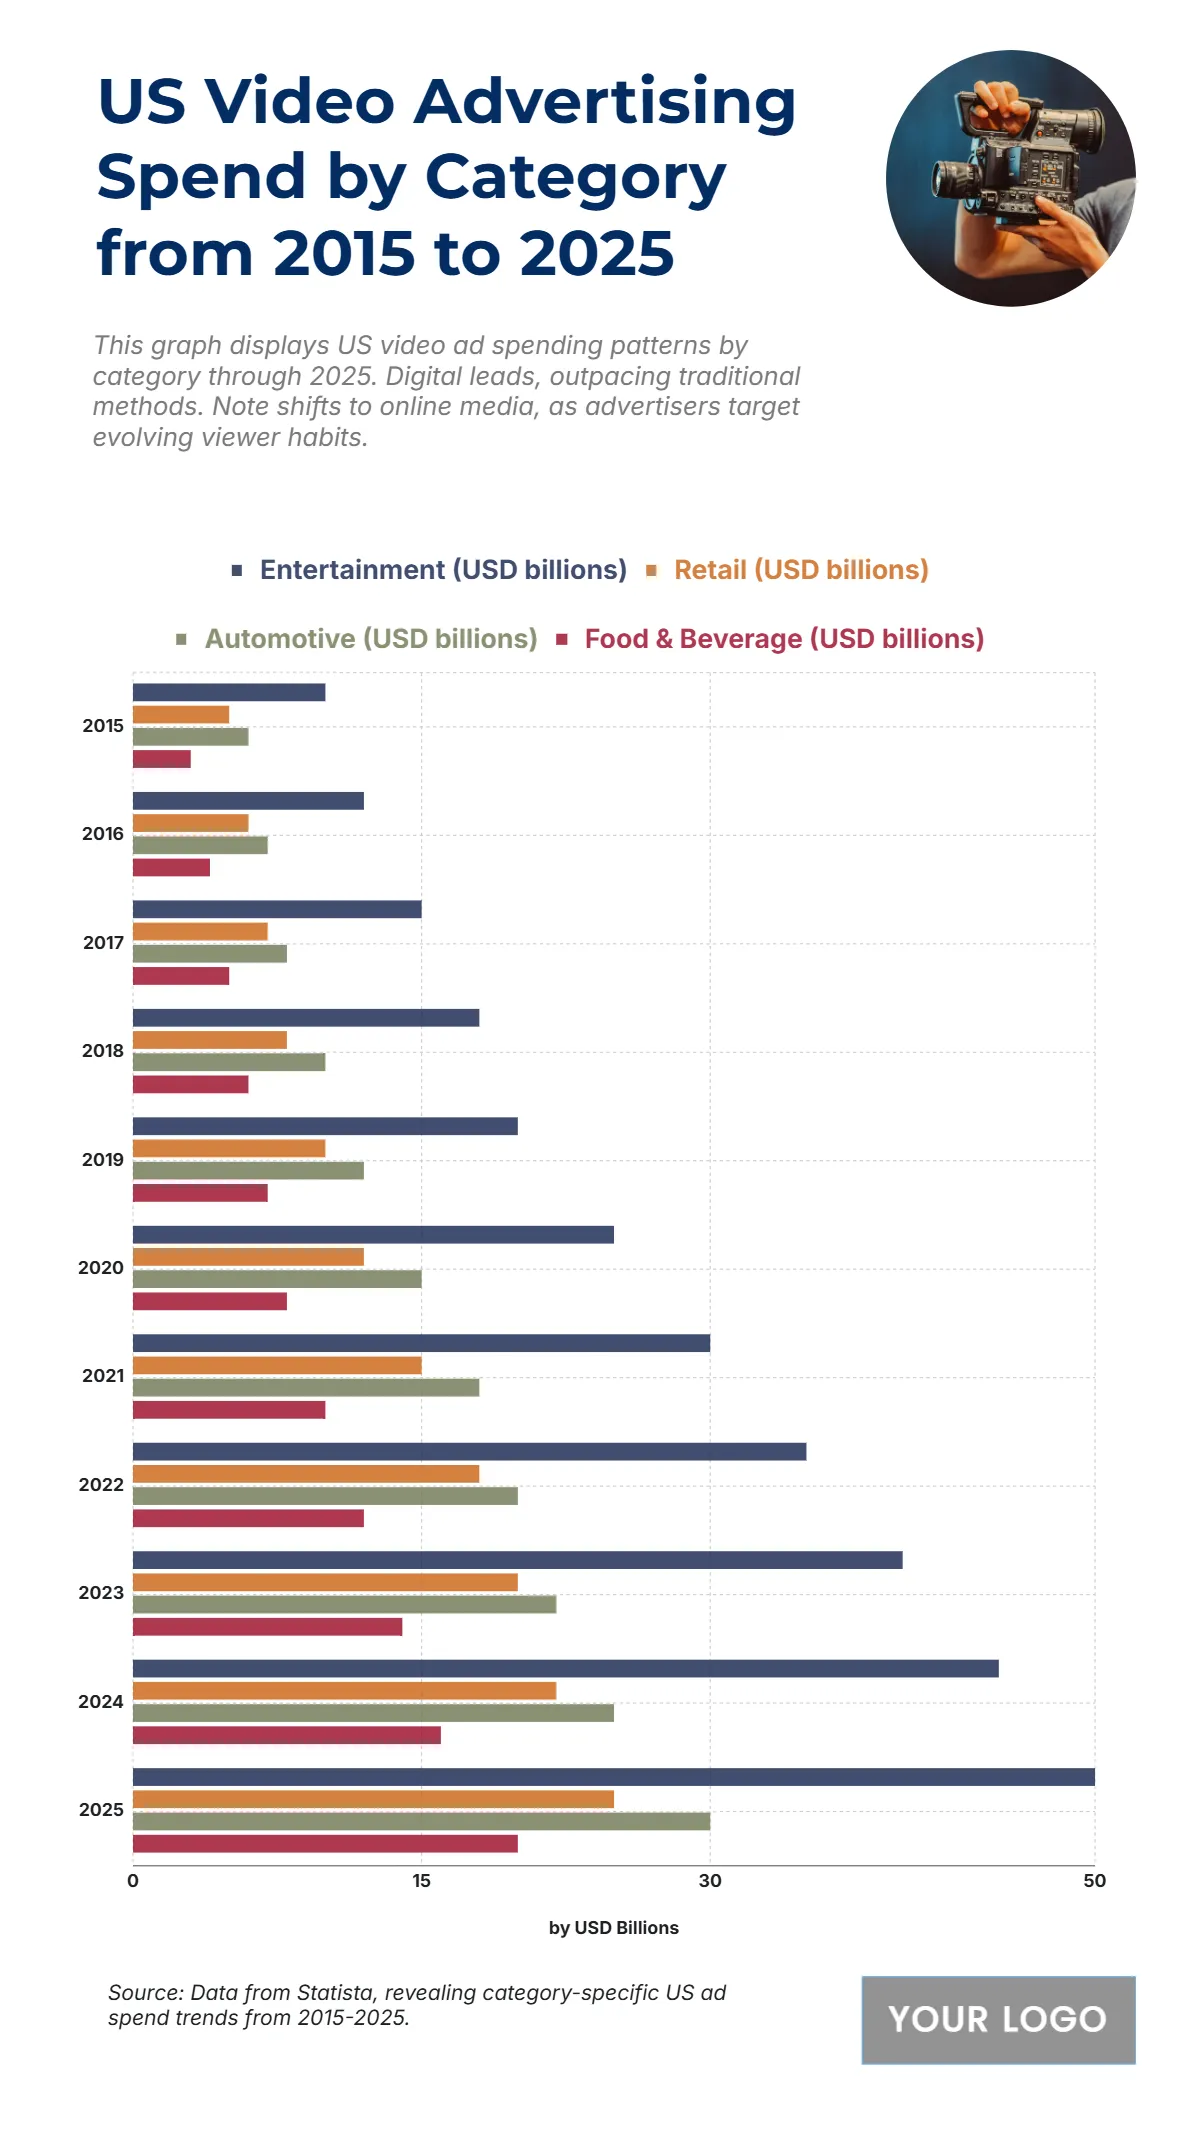
Free US Video Advertising Spend by Category from 2015 to 2025 Chart
The chart displays the US Video Advertising Spend (USD billions) from 2015 to 2025 by category, illustrating a consistent and strong upward trend across all four sectors. Entertainment (USD billions) maintains the highest spending, starting at 10 billion USD in 2015 and projected to reach 50 billion USD in 2025, a five-fold increase. Automotive (USD billions) is the second-largest spender, growing from 6 billion USD in 2015 to 30 billion USD in 2025. Retail (USD billions) spending rises from 5 billion USD to 25 billion USD in 2025. Food & Beverage (USD billions) has the lowest spending, growing from 3 billion USD to 18 billion USD in 2025. The spending gap between Entertainment and Food & Beverage is projected to widen to 32 billion USD by 2025 ($\mathbf{50 \text{ billion USD} - 18 \text{ billion USD} = 32 \text{ billion USD}}$).
| Labels | Entertainment (USD billions) | Retail (USD billions) | Automotive (USD billions) | Food & Beverage (USD billions) |
| 2015 | 10 | 5 | 6 | 3 |
| 2016 | 12 | 6 | 7 | 4 |
| 2017 | 15 | 7 | 8 | 5 |
| 2018 | 18 | 8 | 10 | 6 |
| 2019 | 20 | 10 | 12 | 7 |
| 2020 | 25 | 12 | 15 | 8 |
| 2021 | 30 | 15 | 18 | 10 |
| 2022 | 35 | 18 | 20 | 12 |
| 2023 | 40 | 20 | 22 | 14 |
| 2024 | 45 | 22 | 25 | 16 |
| 2025 | 50 | 25 | 30 | 18 |


