Free US Advertising Revenue by Platform from 2020 to 2025 Chart
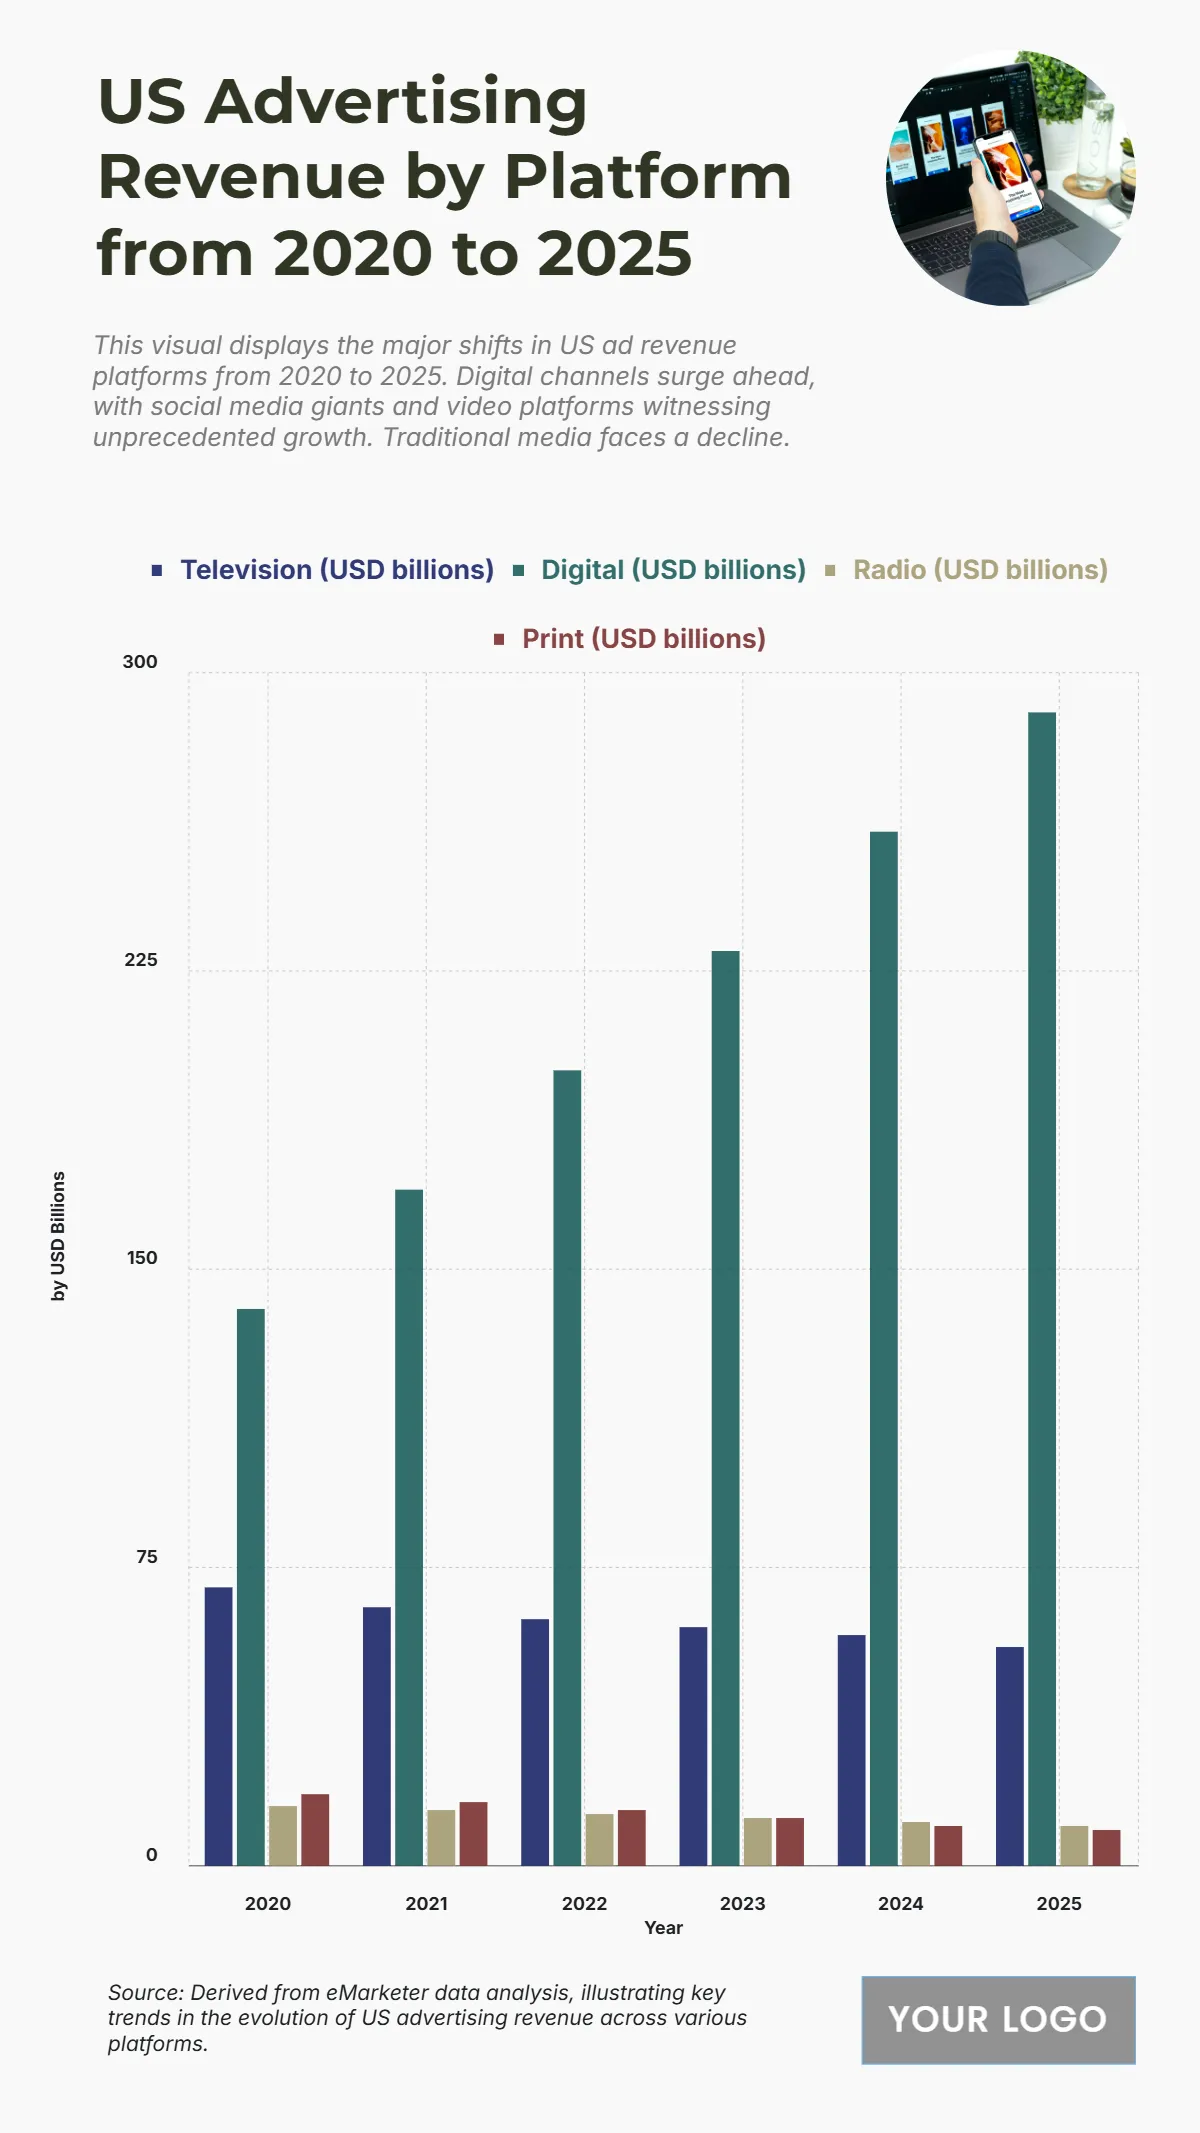
The chart displays the US Advertising Revenue (USD billions) by Platform from 2020 to 2025, illustrating a dramatic shift toward Digital advertising and a consistent decline in traditional media revenue. Digital (USD billions) revenue saw exponential growth, rising from 140 billion USD in 2020 to 290 billion USD in 2025, a 150 billion USD increase. In contrast, Television (USD billions) revenue consistently decreased from 70 billion USD in 2020 to 55 billion USD in 2025. Similarly, Radio (USD billions) revenue declined from 15 billion USD to 10 billion USD, and Print (USD billions) fell from 18 billion USD to 9 billion USD in 2025. By 2025, Digital revenue is projected to be more than five times that of Television revenue ($\mathbf{290 \text{ billion USD} / 55 \text{ billion USD} \approx 5.27}$), confirming the high-speed evolution of the US advertising market.
| Labels | Television (USD billions) | Digital (USD billions) | Radio (USD billions) | Print (USD billions) |
| 2020 | 70 | 140 | 15 | 18 |
| 2021 | 65 | 170 | 14 | 16 |
| 2022 | 62 | 200 | 13 | 14 |
| 2023 | 60 | 230 | 12 | 12 |
| 2024 | 58 | 260 | 11 | 10 |
| 2025 | 55 | 290 | 10 | 9 |


