Free US Mobile Advertising Growth by Industry from 2015 to 2025 Chart
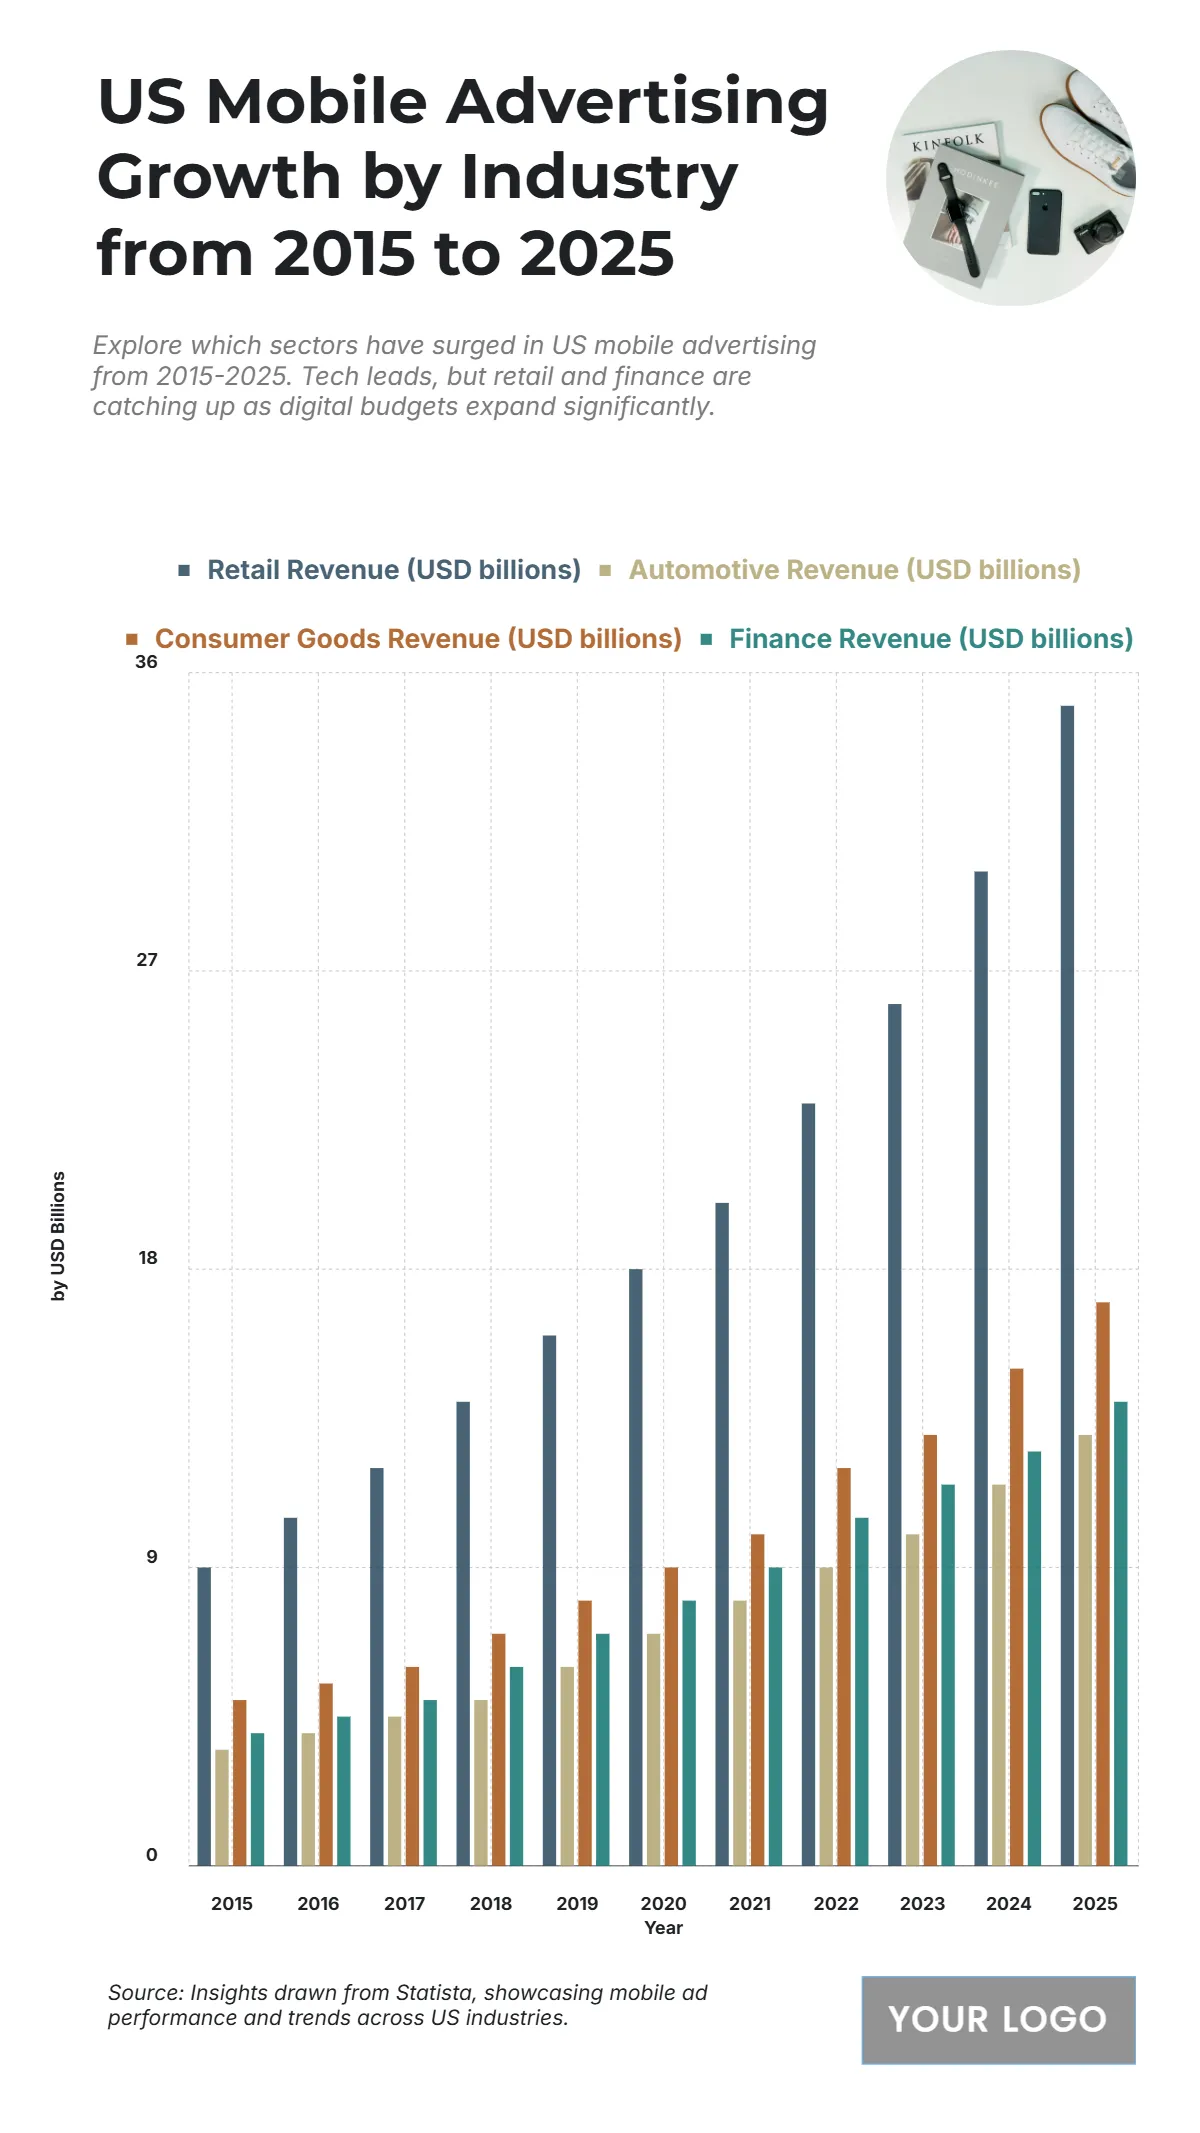
The chart displays the US Mobile Advertising Revenue (USD billions) from 2015 to 2025 by industry, illustrating a consistent and significant increase in revenue across all four major sectors. Retail Revenue (USD billions) maintains the highest spending, starting at 9 billion USD in 2015 and projected to nearly quadruple to 35 billion USD in 2025. Finance Revenue (USD billions) shows the largest proportional growth, increasing from 4 billion USD in 2015 to 14 billion USD in 2025. Consumer Goods Revenue (USD billions) rises from 5 billion USD to 17 billion USD in 2025. Automotive Revenue (USD billions) also shows strong growth, increasing from 3.5 billion USD to 13 billion USD in 2025. The overall growth underscores the increasing investment in mobile advertising across the US, with Retail driving the highest total revenue.
| Labels | Retail Revenue (USD billions) | Automotive Revenue (USD billions) | Consumer Goods Revenue (USD billions) | Finance Revenue (USD billions) |
| 2015 | 9 | 3.5 | 5 | 4 |
| 2016 | 10.5 | 4 | 5.5 | 4.5 |
| 2017 | 12 | 4.5 | 6 | 5 |
| 2018 | 14 | 5 | 7 | 6 |
| 2019 | 16 | 6 | 8 | 7 |
| 2020 | 18 | 7 | 9 | 8 |
| 2021 | 20 | 8 | 10 | 9 |
| 2022 | 23 | 9 | 12 | 10.5 |
| 2023 | 26 | 10 | 13 | 11.5 |
| 2024 | 30 | 11.5 | 15 | 12.5 |
| 2025 | 35 | 13 | 17 | 14 |


