Free US Online Retailer Ad Spend by Category from 2015 to 2025 Chart
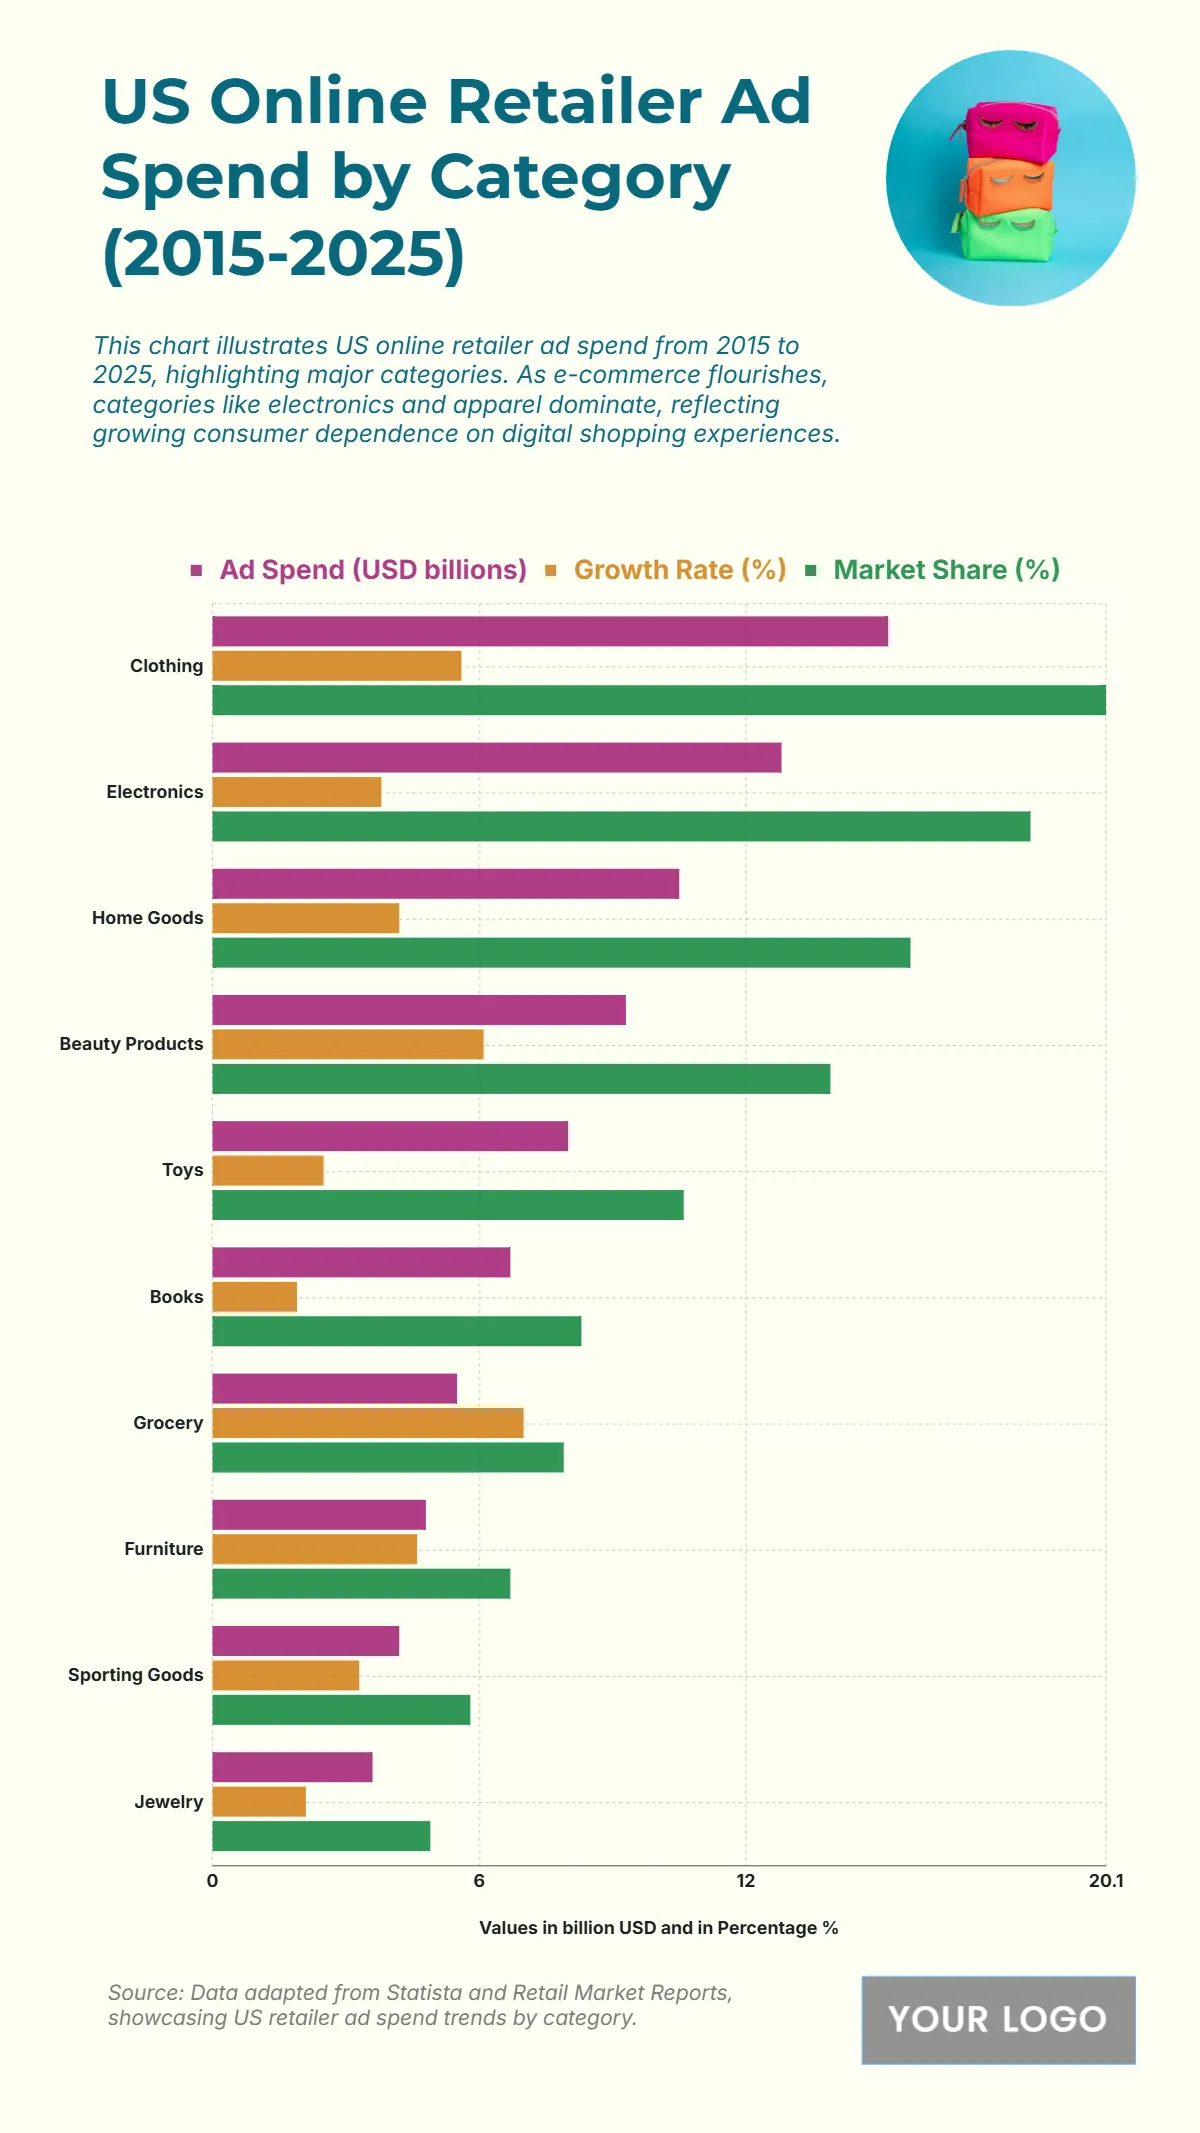
The chart displays the US Online Retailer Ad Spend by Category from 2015 to 2025, detailing Ad Spend (USD billions), Growth Rate (%), and Market Share (%) across ten retail categories. Clothing leads with the highest Ad Spend (USD billions) at 15.2 billion USD and the highest Market Share (%) at 20.1%. Electronics follows closely with 12.8 billion USD Ad Spend and 18.4% Market Share. Grocery has the highest Growth Rate (%) at 7%, despite a modest Ad Spend (USD billions) of 5.5 billion USD. Beauty Products also show high growth at 6.1%. Jewelry has the lowest Ad Spend (USD billions) at 3.6 billion USD and the lowest Market Share (%) at 4.9%. The data highlights the dominance of Clothing and Electronics in online retail ad spending, while categories like Grocery are experiencing the most rapid growth in investment.
| Labels | Ad Spend (USD billions) | Growth Rate (%) | Market Share (%) |
| Clothing | 15.2 | 5.6 | 20.1 |
| Electronics | 12.8 | 3.8 | 18.4 |
| Home Goods | 10.5 | 4.2 | 15.7 |
| Beauty Products | 9.3 | 6.1 | 13.9 |
| Toys | 8 | 2.5 | 10.6 |
| Books | 6.7 | 1.9 | 8.3 |
| Grocery | 5.5 | 7 | 7.9 |
| Furniture | 4.8 | 4.6 | 6.7 |
| Sporting Goods | 4.2 | 3.3 | 5.8 |
| Jewelry | 3.6 | 2.1 | 4.9 |


