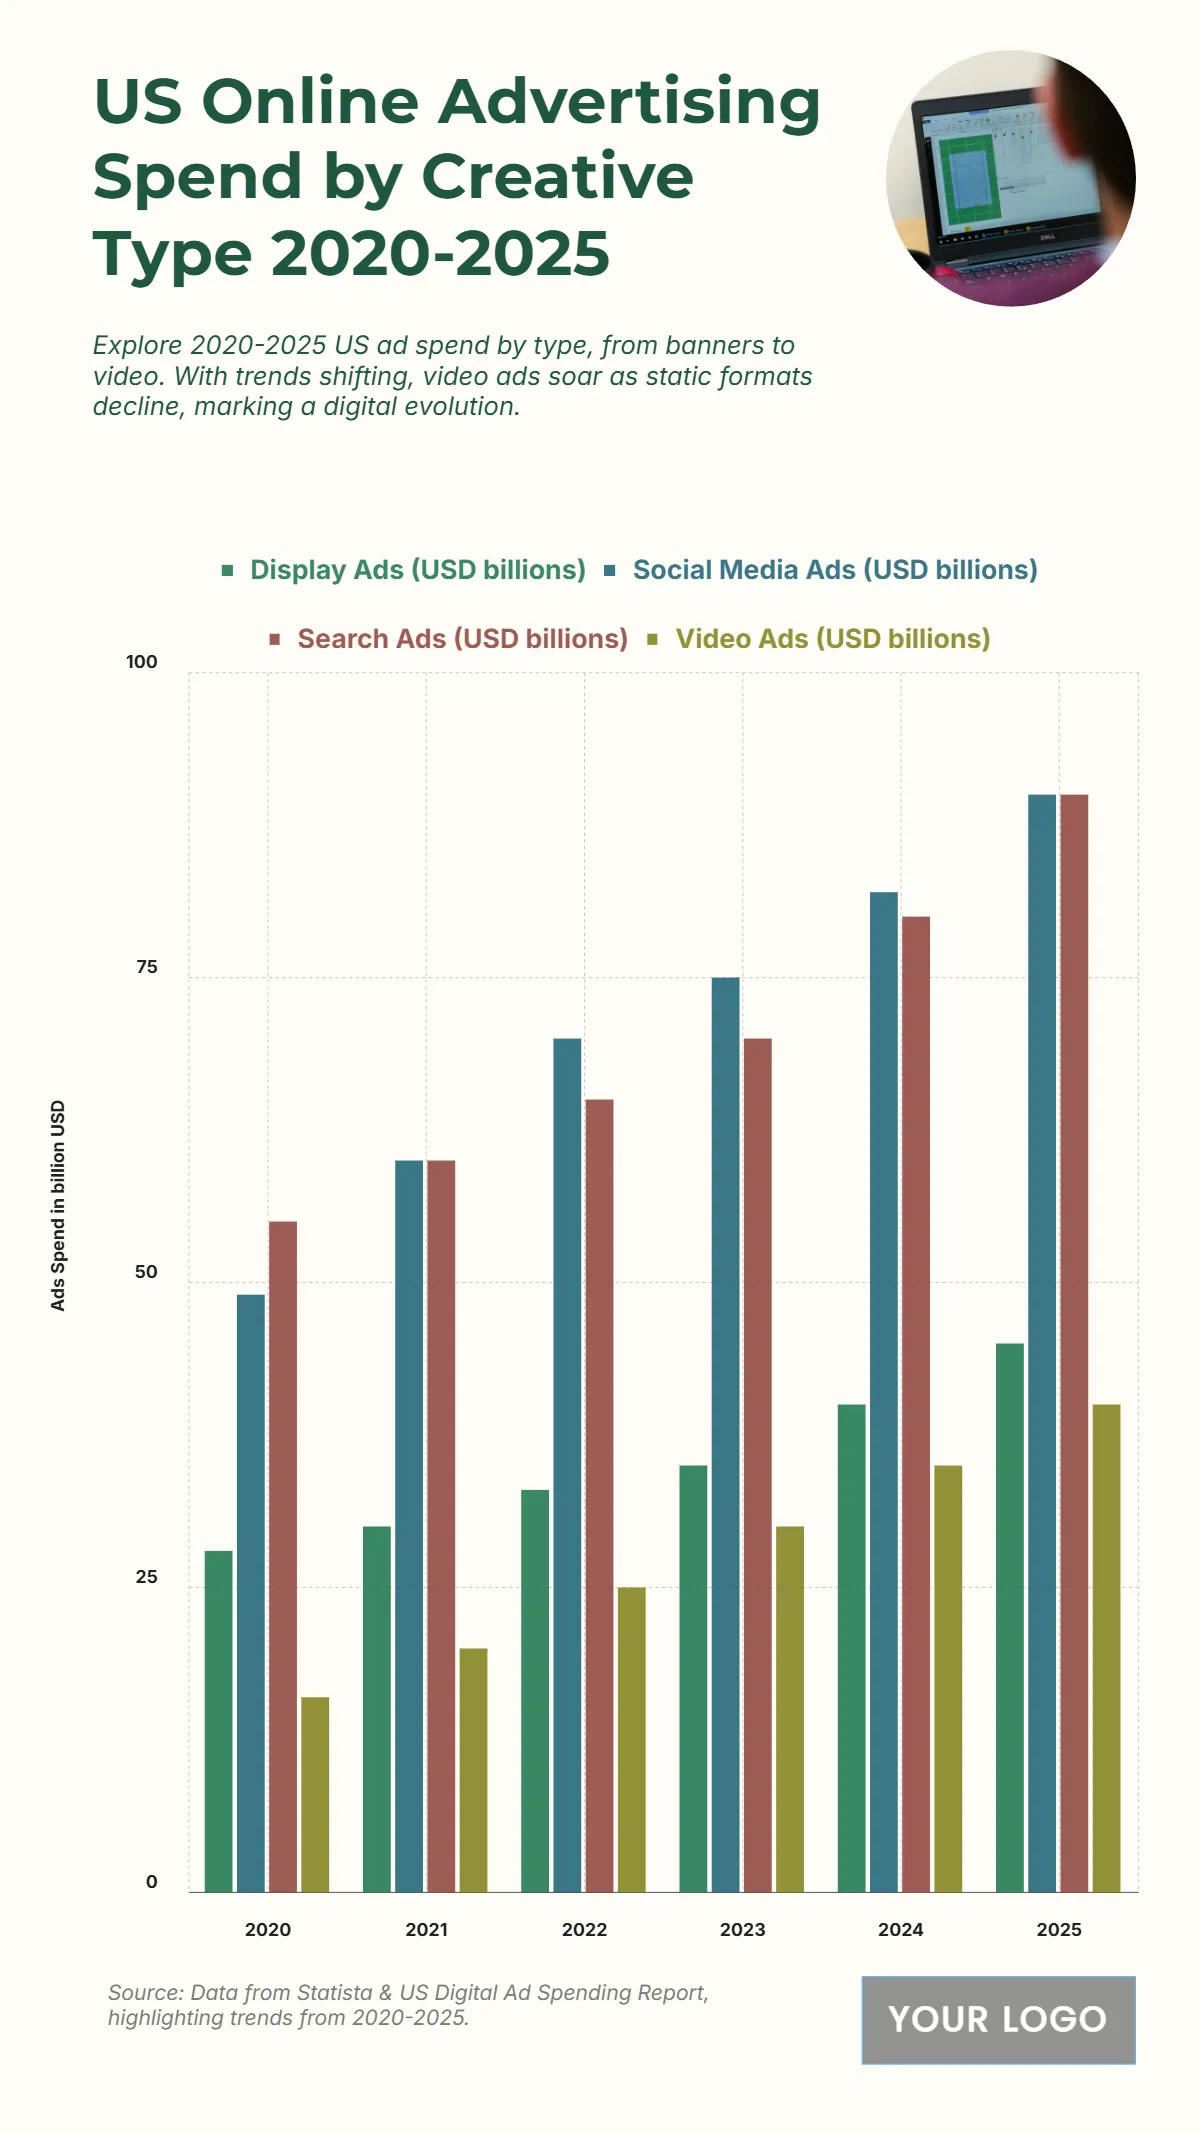
Free US Online Advertising Spend by Creative Type from 2020 to 2025 Chart
The chart displays the US Online Advertising Spend by Creative Type from 2020 to 2025, illustrating a dramatic surge in Search Ads (USD billions) and Social Media Ads (USD billions), while Display Ads (USD billions) shows steady growth. Search Ads (USD billions) and Social Media Ads (USD billions) are the largest categories and exhibit the highest growth, both projected to reach 90 billion USD in 2025. Search Ads started at 55 billion USD in 2020, and Social Media Ads started at 49 billion USD. Video Ads (USD billions) also show strong growth, nearly tripling from 16 billion USD in 2020 to 40 billion USD in 2025. Display Ads (USD billions) show the slowest growth, increasing from 28 billion USD to 45 billion USD in 2025. The data highlights the profound shift toward performance-based and interactive ad formats, with the combined spend on Search and Social Media projected at 180 billion USD by 2025.
| Labels | Display Ads (USD billions) | Social Media Ads (USD billions) | Search Ads (USD billions) | Video Ads (USD billions) |
| 2020 | 28 | 49 | 55 | 16 |
| 2021 | 30 | 60 | 60 | 20 |
| 2022 | 33 | 70 | 65 | 25 |
| 2023 | 35 | 75 | 70 | 30 |
| 2024 | 40 | 82 | 80 | 35 |
| 2025 | 45 | 90 | 90 | 40 |


