Free US Mobile Ad Spend Share by Device from 2015 to 2025 Chart
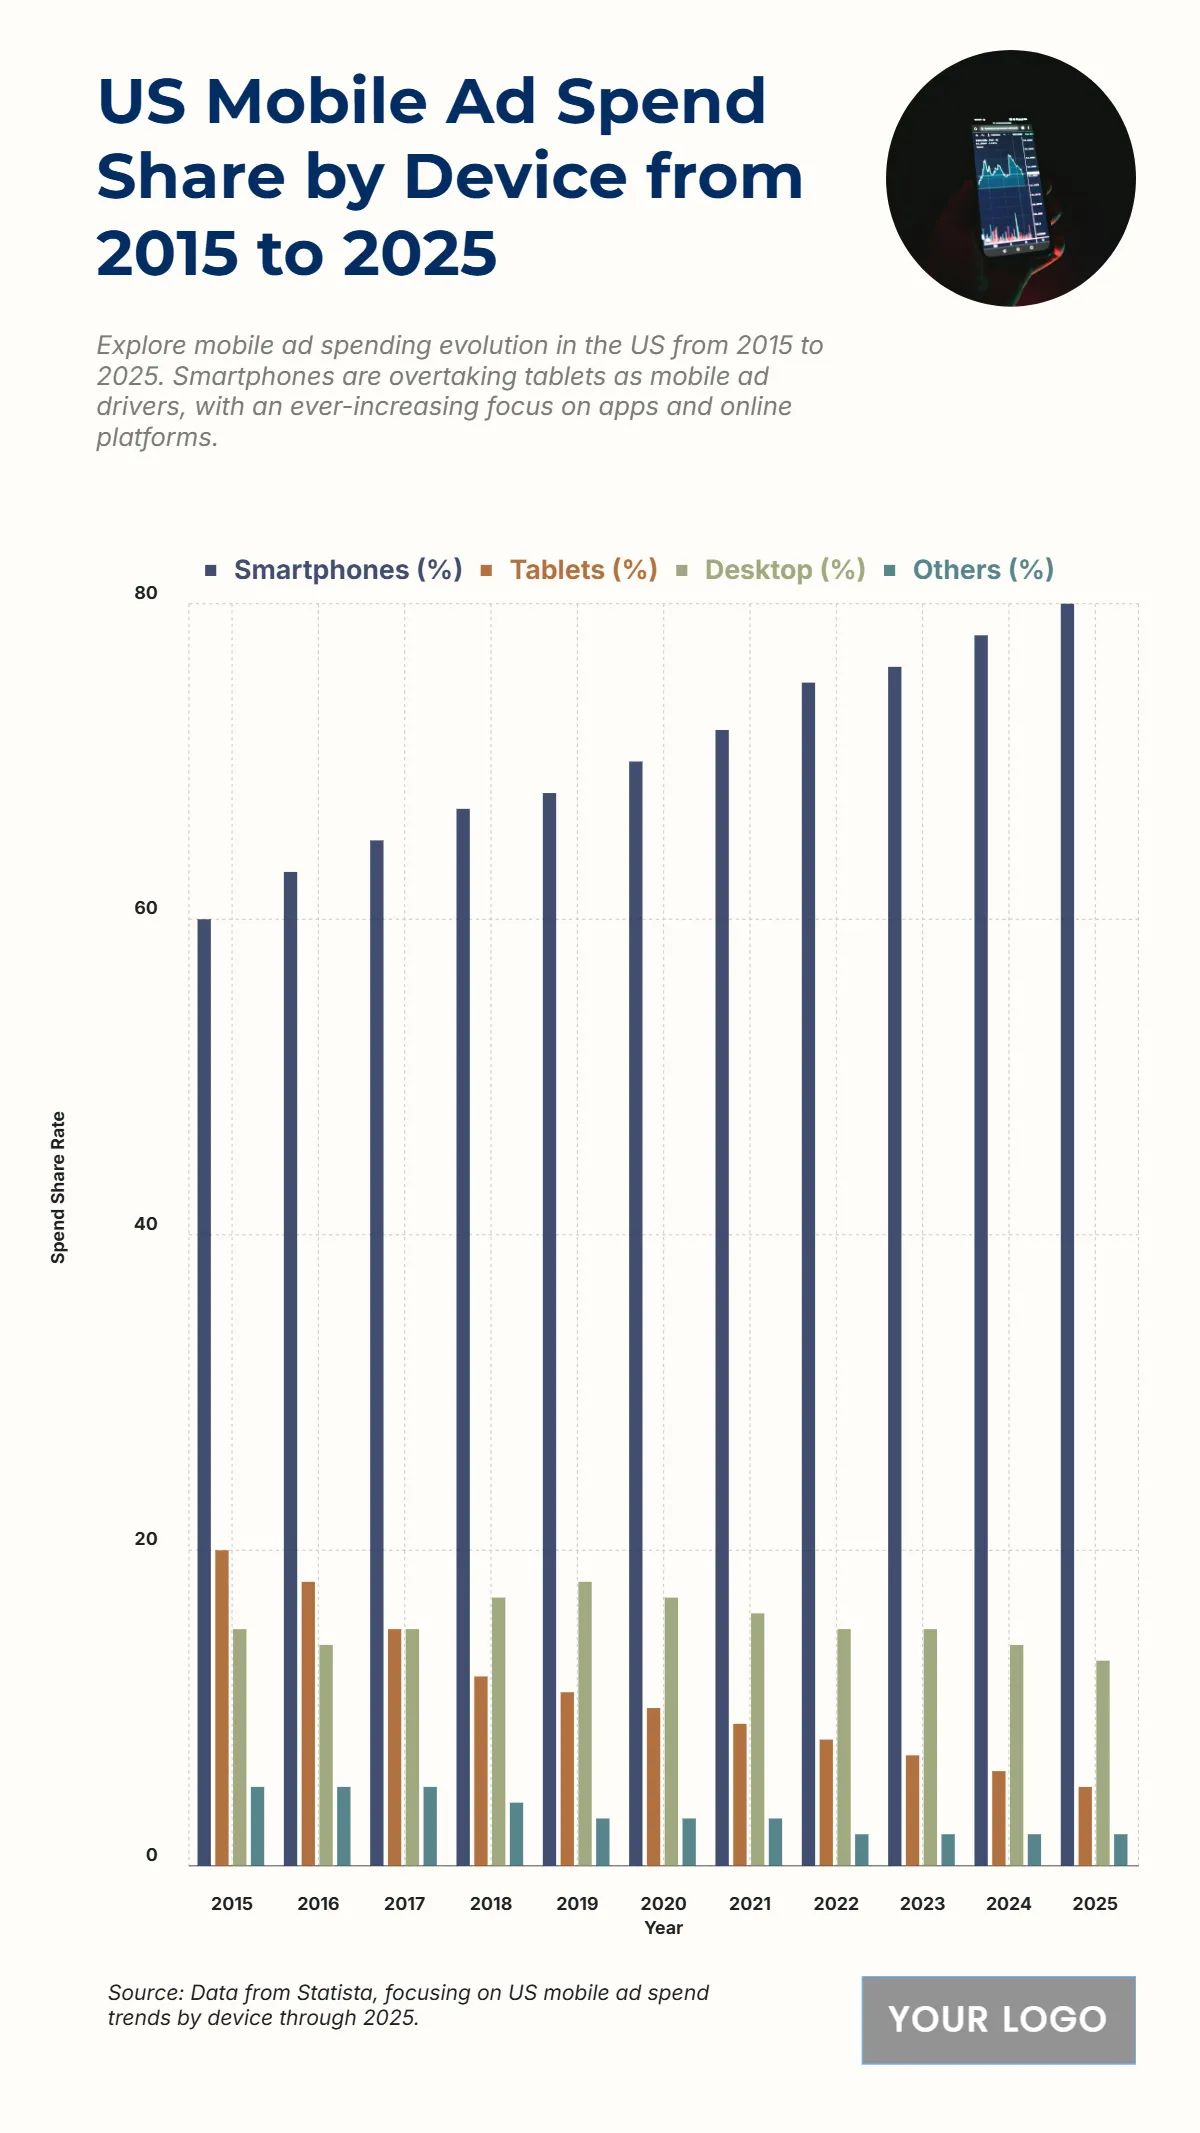
The chart displays the US Mobile Ad Spend Share by Device from 2015 to 2025, illustrating a pronounced shift toward Smartphones (%) at the expense of Tablets (%) and Desktop (%). Smartphones (%) dominated the share, increasing from 60% in 2015 to a projected peak of 80% in 2025. Conversely, the share for Tablets (%) dropped dramatically from 20% in 2015 to 5% in 2025. The Desktop (%) share also showed a decline over the decade, starting at 15% in 2015 and projected to be 13% in 2025, despite a slight mid-period surge. The Others (%) category remains a consistently low share, starting at 5% and dropping to 2% in 2025. The data highlights the overwhelming consolidation of mobile ad spending onto Smartphone devices, capturing 4/5 of the total mobile ad spend by 2025.
| Labels | Smartphones (%) | Tablets (%) | Desktop (%) | Others (%) |
| 2015 | 60 | 20 | 15 | 5 |
| 2016 | 63 | 18 | 14 | 5 |
| 2017 | 65 | 15 | 15 | 5 |
| 2018 | 67 | 12 | 17 | 4 |
| 2019 | 68 | 11 | 18 | 3 |
| 2020 | 70 | 10 | 17 | 3 |
| 2021 | 72 | 9 | 16 | 3 |
| 2022 | 75 | 8 | 15 | 2 |
| 2023 | 76 | 7 | 15 | 2 |
| 2024 | 78 | 6 | 14 | 2 |
| 2025 | 80 | 5 | 13 | 2 |


