Free US Retailer Conversion Rate by Advertising Channel from 2015 to 2025 Chart
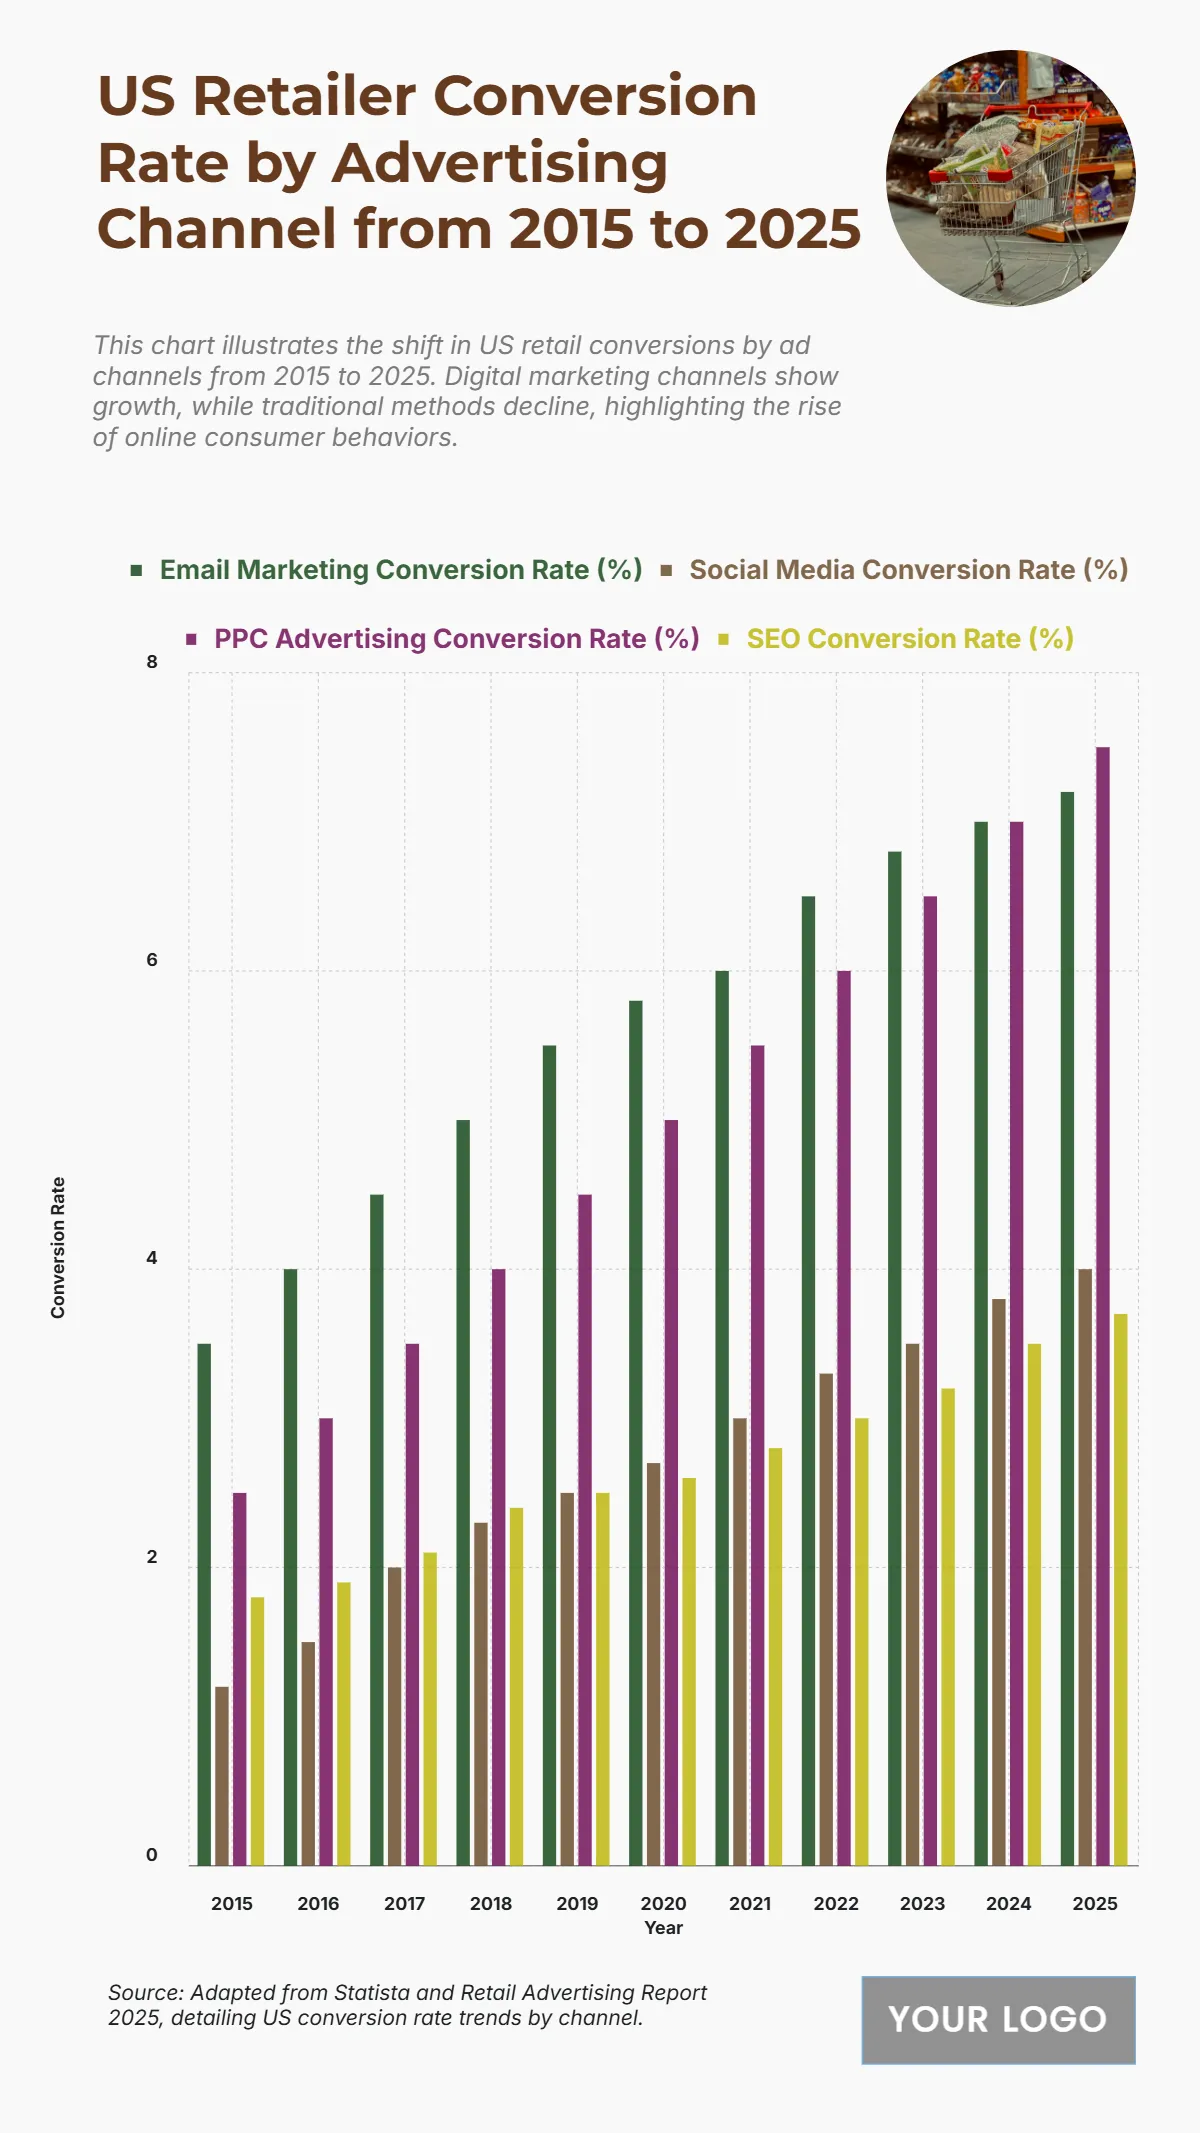
The chart displays the US Retailer Conversion Rate (%) by Advertising Channel from 2015 to 2025, illustrating a consistent and continuous upward trend across all four key channels. Email Marketing Conversion Rate (%) is the highest, starting at 3.5% in 2015 and projected to more than double to 7.2% in 2025. PPC Advertising Conversion Rate (%) follows with significant growth, increasing from 2.5% in 2015 to 7.5% in 2025. Social Media Conversion Rate (%) also demonstrates substantial growth, rising from 1.2% to 4% in 2025. SEO Conversion Rate (%) has the lowest rates but shows strong proportional growth, increasing from 1.8% to 3.7% in 2025. The data underscores the dominance of Email Marketing and PPC Advertising in driving retail conversions, with all channels becoming significantly more effective over the decade.
| Labels | Email Marketing Conversion Rate (%) | Social Media Conversion Rate (%) | PPC Advertising Conversion Rate (%) | SEO Conversion Rate (%) |
| 2015 | 3.5 | 1.2 | 2.5 | 1.8 |
| 2016 | 4 | 1.5 | 3 | 1.9 |
| 2017 | 4.5 | 2 | 3.5 | 2.1 |
| 2018 | 5 | 2.3 | 4 | 2.4 |
| 2019 | 5.5 | 2.5 | 4.5 | 2.5 |
| 2020 | 5.8 | 2.7 | 5 | 2.6 |
| 2021 | 6 | 3 | 5.5 | 2.8 |
| 2022 | 6.5 | 3.3 | 6 | 3 |
| 2023 | 6.8 | 3.5 | 6.5 | 3.2 |
| 2024 | 7 | 3.8 | 7 | 3.5 |
| 2025 | 7.2 | 4 | 7.5 | 3.7 |


