Free US Retail Campaign Performance Index from 2018 to 2025 Chart
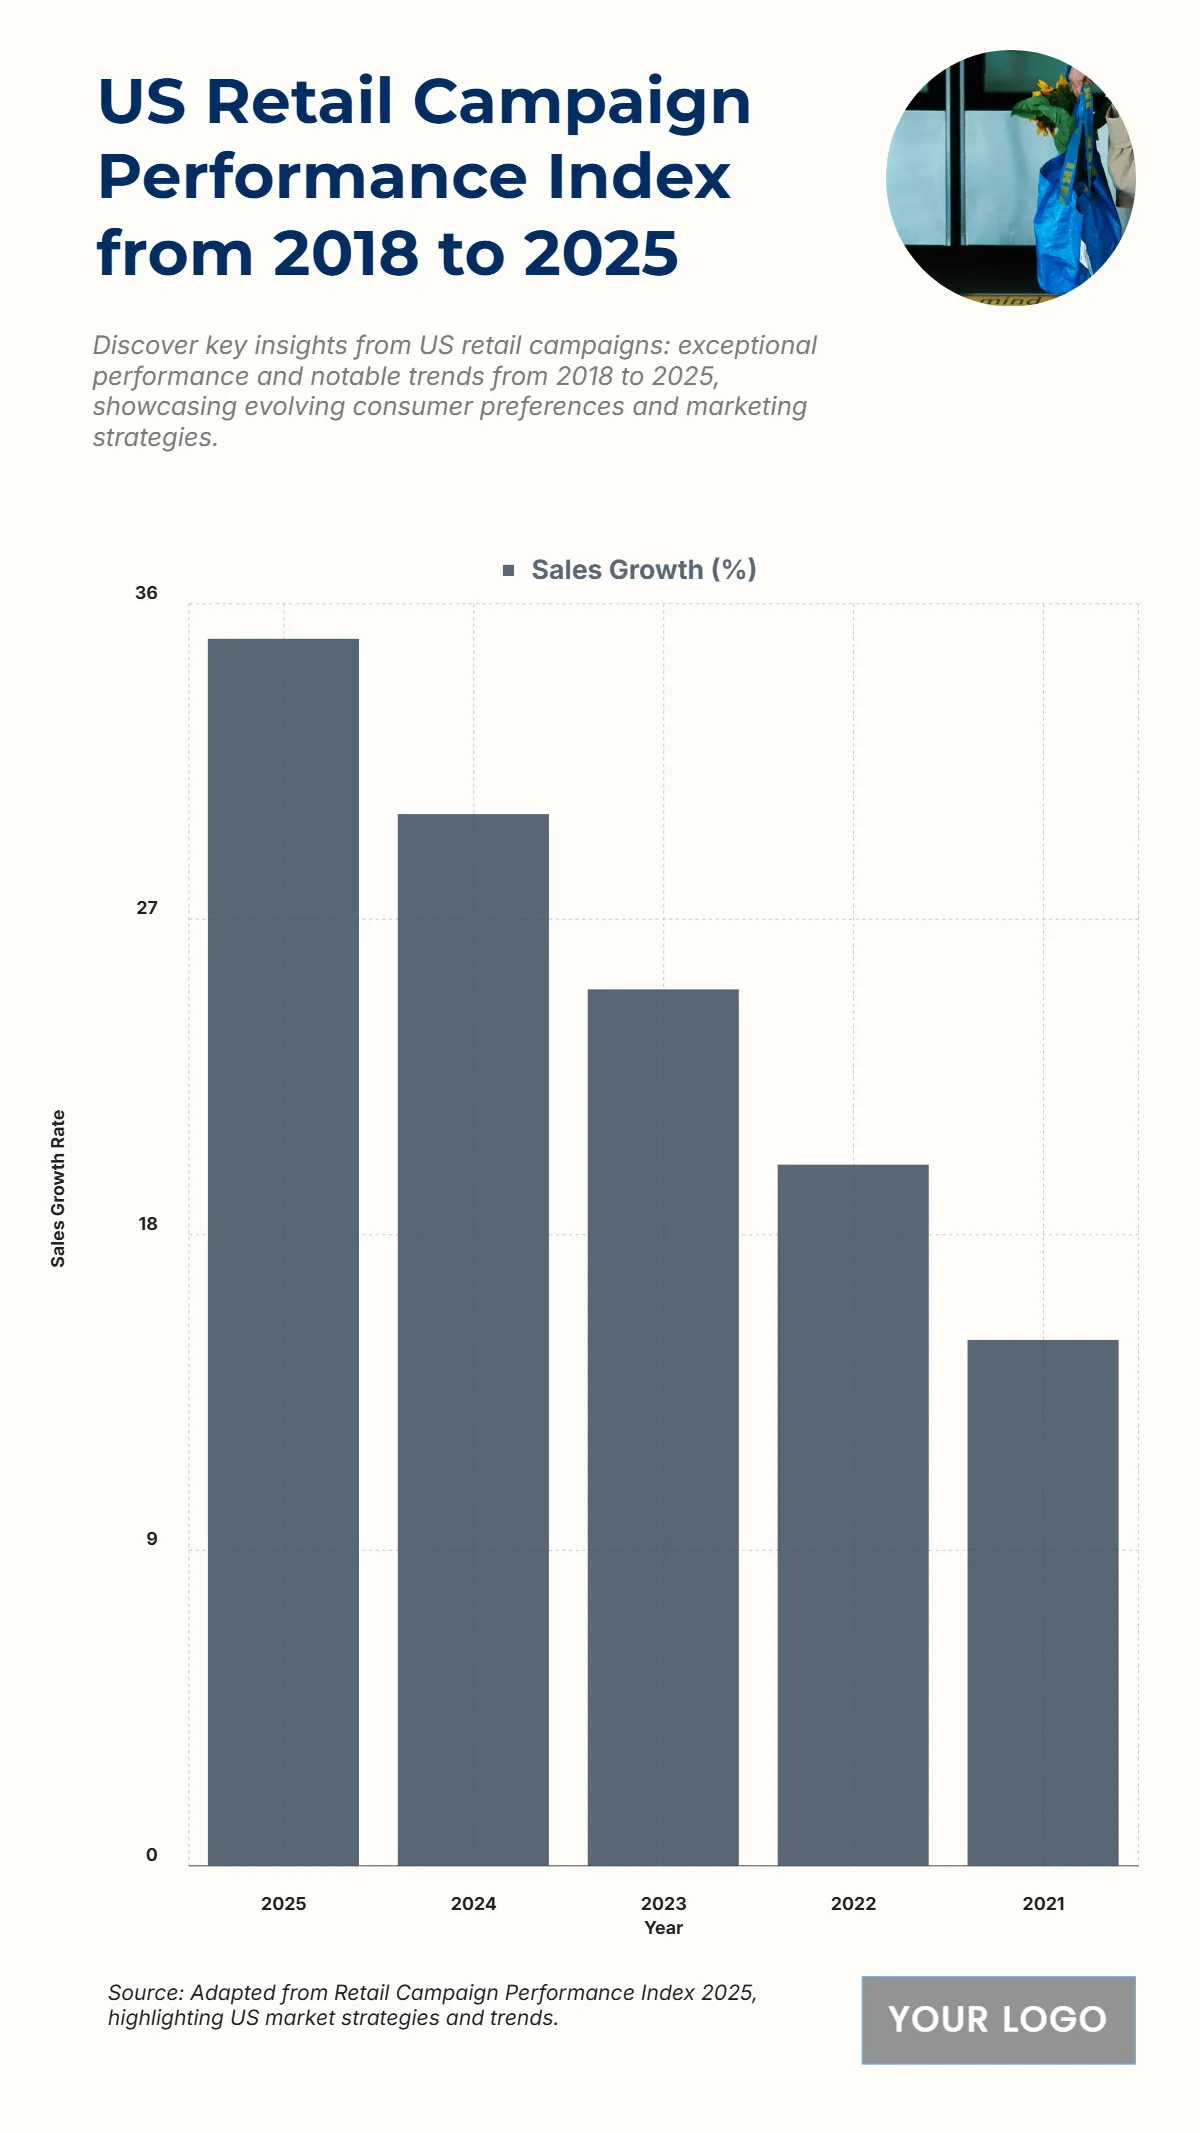
The chart displays the US Retail Campaign Sales Growth (%) from 2021 to 2025, illustrating a significant and continuous upward trend in sales performance over this five-year period. The Sales Growth (%) started at its lowest point in 2021 with 15%. It then increased to 20% in 2022 and 25% in 2023. The upward trend is projected to continue with 30% in 2024 and peak at 35% in 2025. The total projected increase in sales growth is 20 percentage points ($\mathbf{35\% - 15\% = 20\%}$) from 2021 to 2025. This sustained growth suggests that US retail campaigns are becoming increasingly effective at driving sales, reflecting a strategic adaptation to evolving consumer preferences and marketing strategies.
| Labels | Sales Growth (%) |
| 2025 | 35 |
| 2024 | 30 |
| 2023 | 25 |
| 2022 | 20 |
| 2021 | 15 |


