Free US Online Ad View Rate by Device from 2020 to 2025 Chart
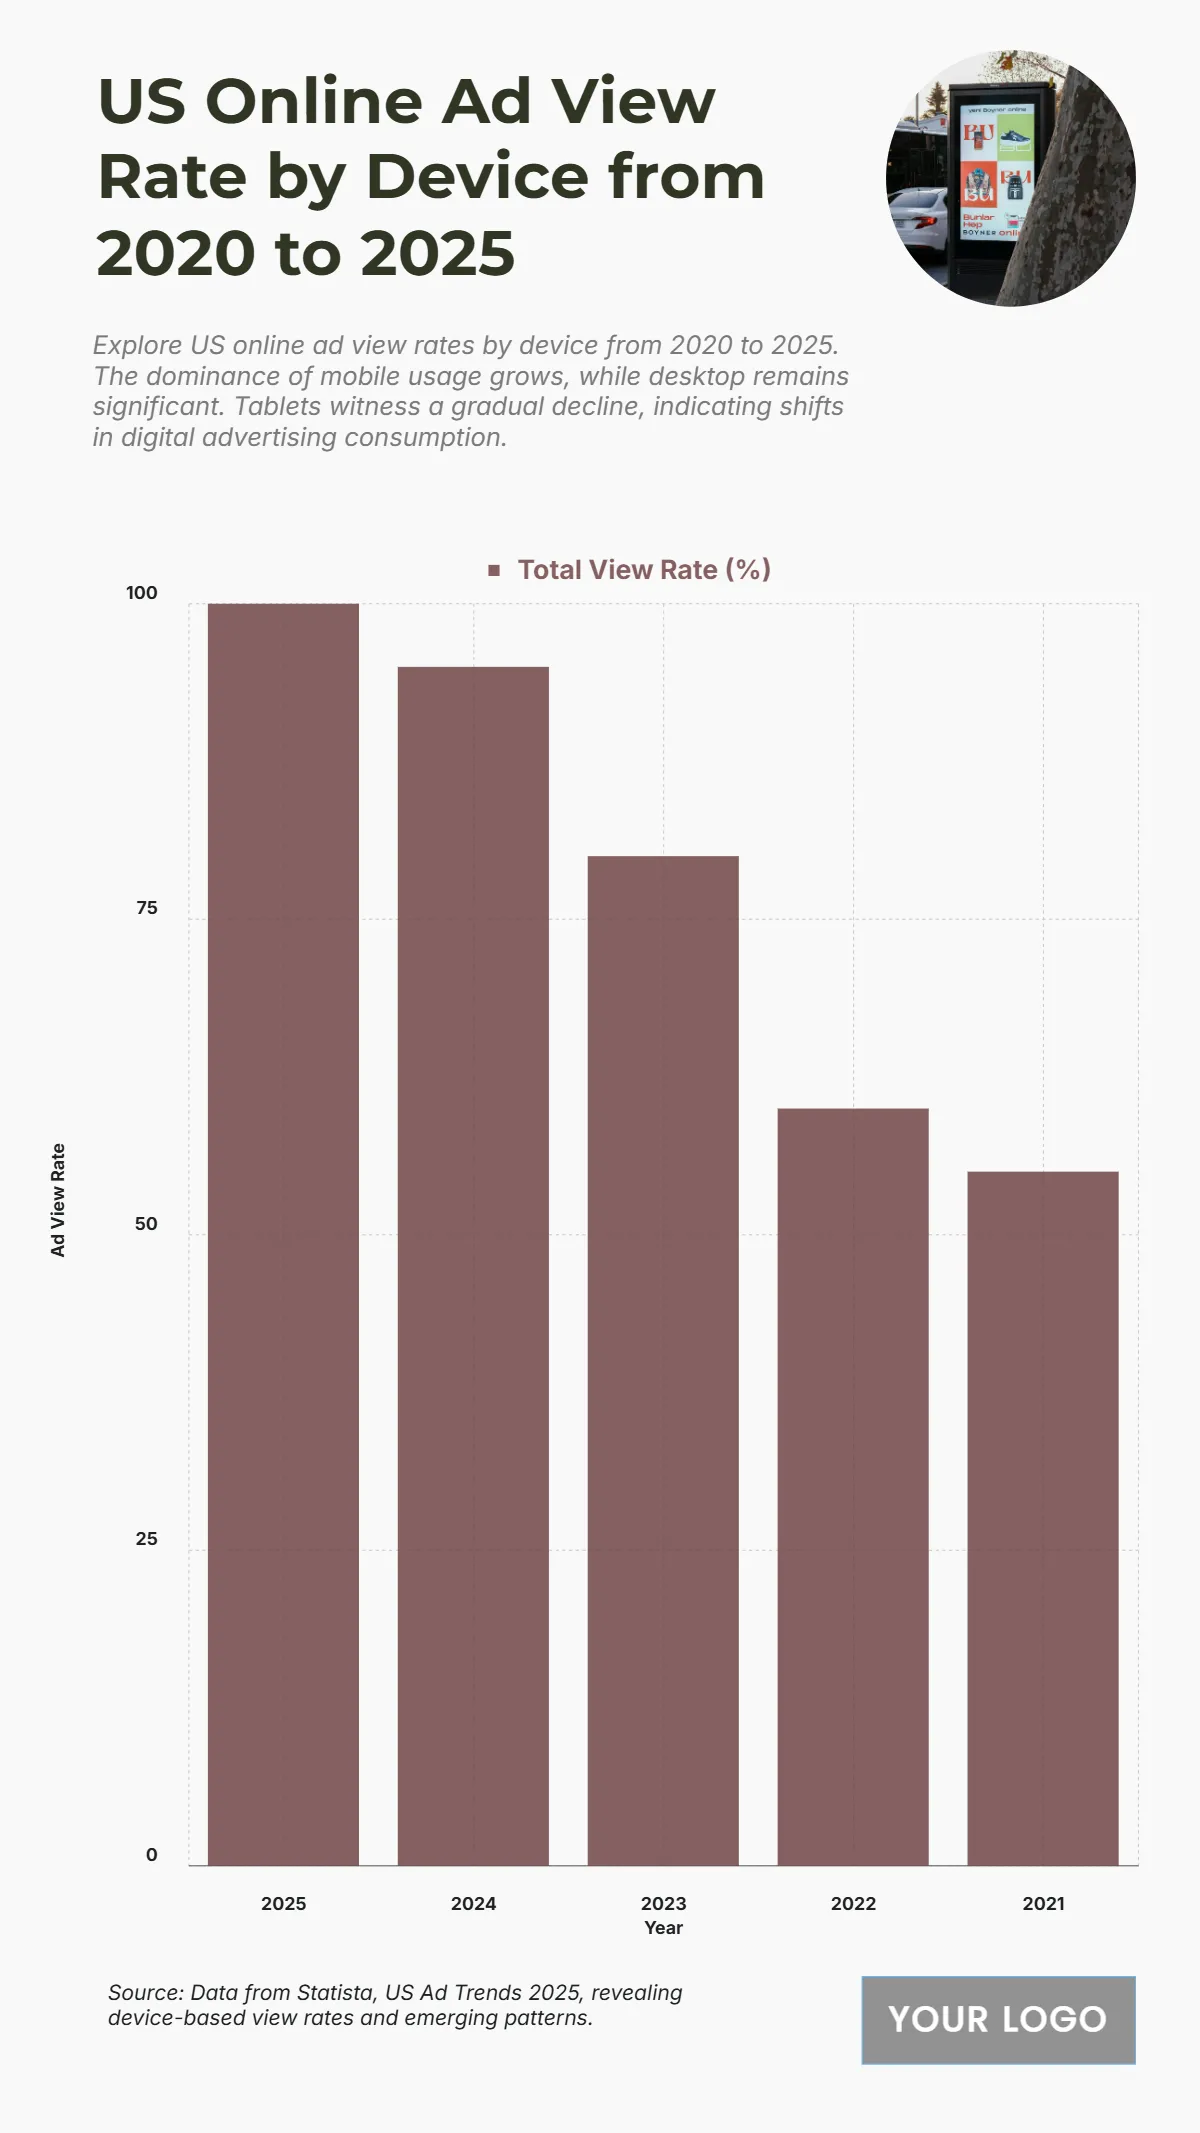
The chart displays the US Online Ad Total View Rate (%) from 2021 to 2025, illustrating a significant and continuous upward trend in the effectiveness of ads as measured by viewability. The Total View Rate (%) started at 55% in 2021. It then saw a notable increase to 60% in 2022 and jumped to 80% in 2023. The upward trend is projected to continue strongly, reaching 95% in 2024 and peaking at 100% in 2025. The total projected increase in the Total View Rate is 45 percentage points ($\mathbf{100\% - 55\% = 45\%}$) from 2021 to 2025. This dramatic increase suggests substantial improvements in digital ad formats, placement, and measurement, leading to nearly perfect viewability across devices by 2025.
| Labels | Total View Rate (%) |
| 2025 | 100 |
| 2024 | 95 |
| 2023 | 80 |
| 2022 | 60 |
| 2021 | 55 |


