Free US Retail Advertising Share by Region from 2018 to 2025 Chart
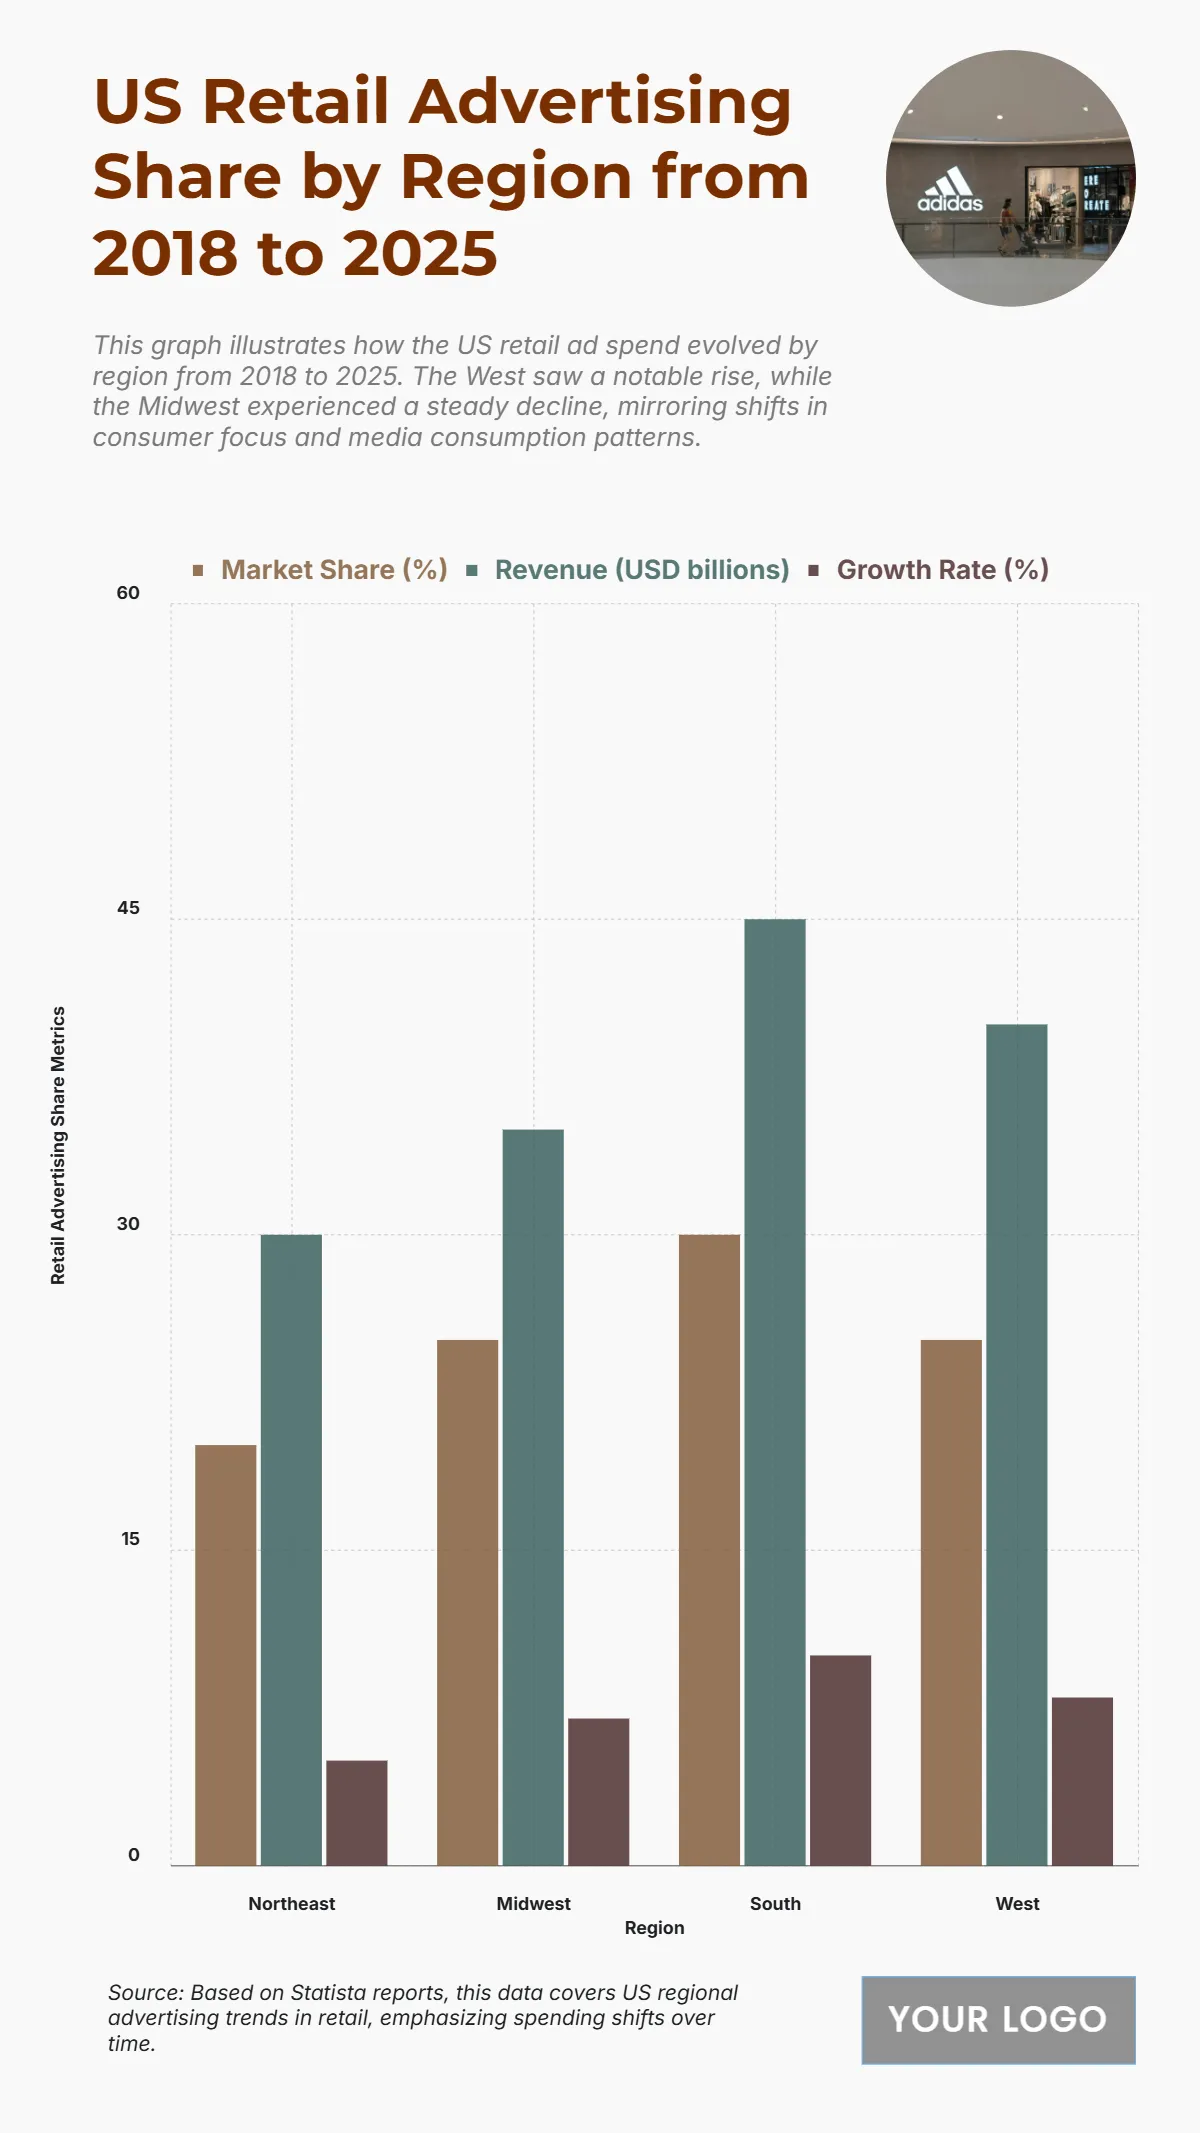
The chart displays the US Retail Advertising Share by Region from 2018 to 2025, detailing Market Share (%), Revenue (USD billions), and Growth Rate (%). The South region leads in both Revenue (USD billions) at 45 billion USD and Growth Rate (%) at 10%, while holding the highest Market Share (%) at 30%. The West and Midwest regions share a 25% Market Share (%), with the West generating 40 billion USD Revenue and an 8% Growth Rate (%), and the Midwest generating 35 billion USD Revenue and a 7% Growth Rate (%). The Northeast has the lowest Market Share (%) at 20%, Revenue (USD billions) at 30 billion USD, and Growth Rate (%) at 5%. The data confirms the South as the most significant region for US retail advertising in terms of both size and growth.
| Labels | Market Share (%) | Revenue (USD billions) | Growth Rate (%) |
| Northeast | 20 | 30 | 5 |
| Midwest | 25 | 35 | 7 |
| South | 30 | 45 | 10 |
| West | 25 | 40 | 8 |


