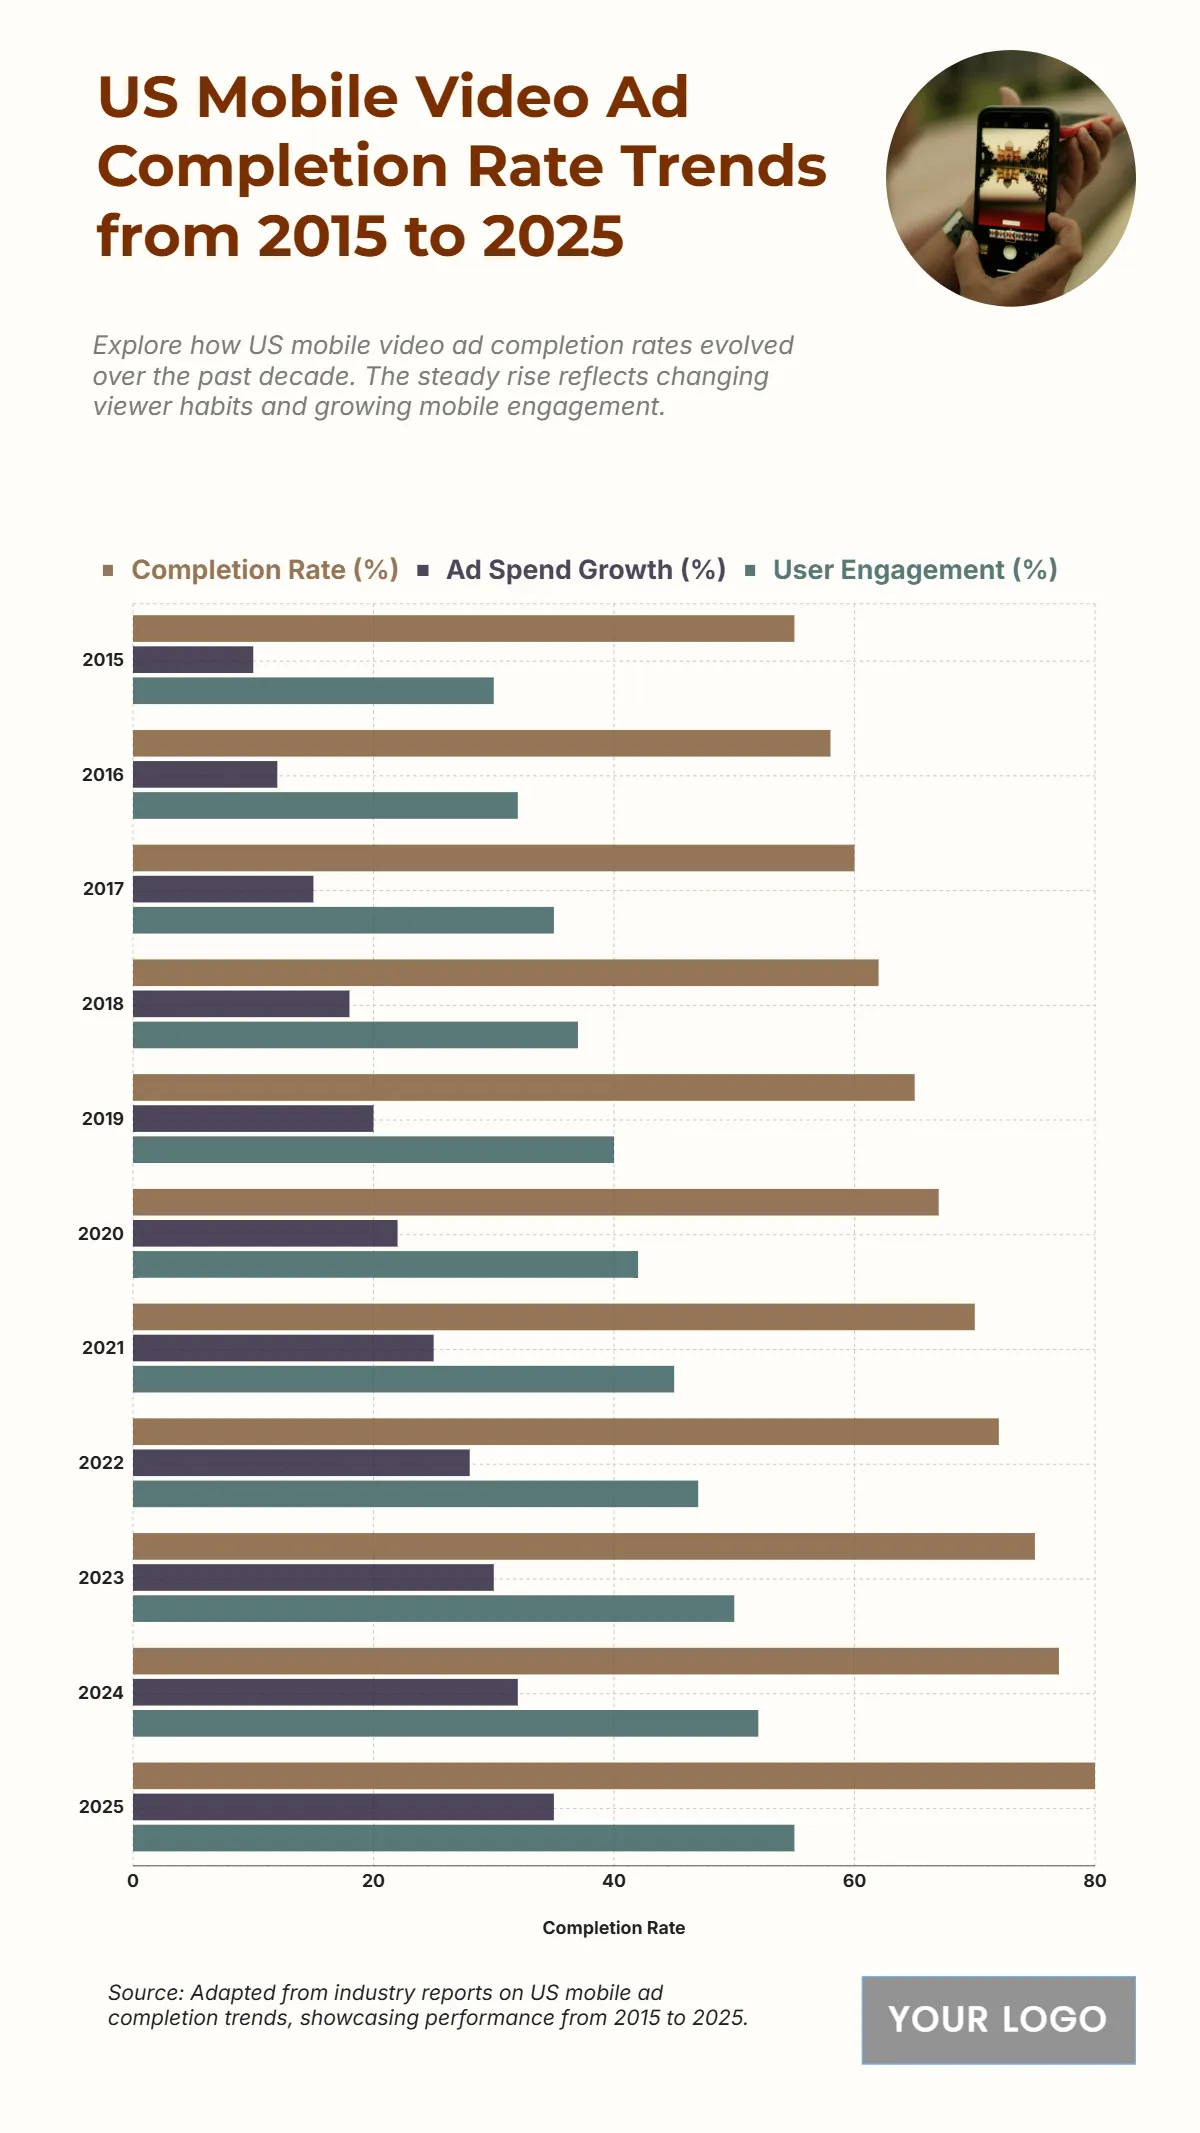
Free US Mobile Video Ad Completion Rate Trends from 2015 to 2025 Chart
The chart displays the US Mobile Video Ad Completion Rate (%), Ad Spend Growth (%), and User Engagement (%) from 2015 to 2025, illustrating a consistent and continuous increase across all three performance metrics over the decade. The Completion Rate (%) started at 55% in 2015 and is projected to reach 80% in 2025. Ad Spend Growth (%) increased from 10% in 2015 to a projected 35% in 2025. Similarly, User Engagement (%) grew from 30% in 2015 to 55% in 2025. Notably, all three metrics showed steady annual growth, with Completion Rate projected to increase by 25 percentage points and Ad Spend Growth projected to increase by 25 percentage points over the ten-year period. This concurrent rise confirms a greater investment in, and higher performance from, mobile video advertising.
| Labels | Completion Rate (%) | Ad Spend Growth (%) | User Engagement (%) |
| 2015 | 55 | 10 | 30 |
| 2016 | 58 | 12 | 32 |
| 2017 | 60 | 15 | 35 |
| 2018 | 62 | 18 | 37 |
| 2019 | 65 | 20 | 40 |
| 2020 | 67 | 22 | 42 |
| 2021 | 70 | 25 | 45 |
| 2022 | 72 | 28 | 47 |
| 2023 | 75 | 30 | 50 |
| 2024 | 77 | 32 | 52 |
| 2025 | 80 | 35 | 55 |


