Free US Retailer Marketing Spend vs Sales Revenue from 2015 to 2025 Chart
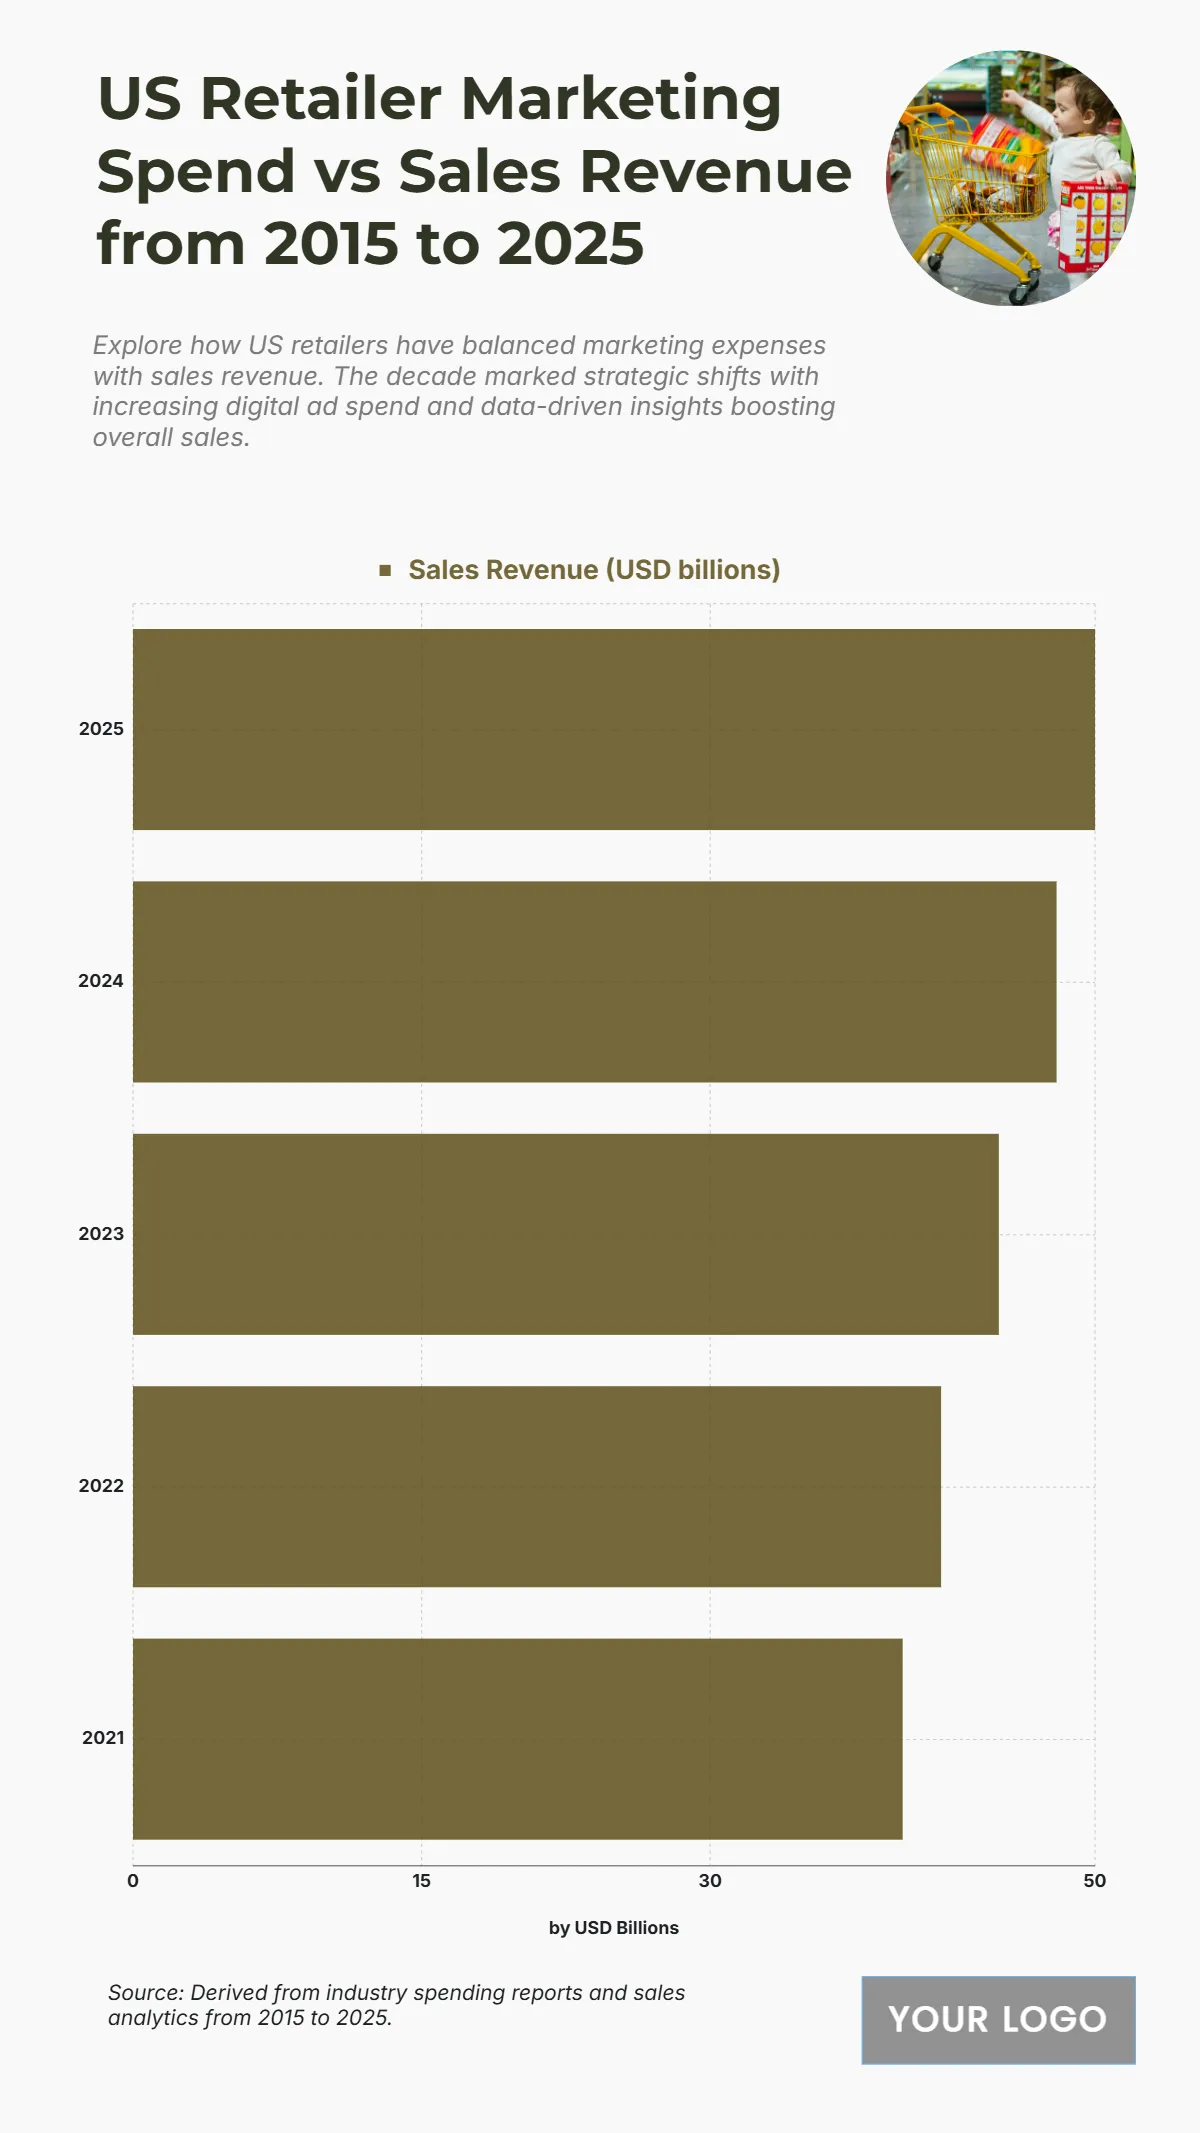
The chart displays the US Retailer Marketing Spend vs. Sales Revenue (USD billions) from 2021 to 2025, illustrating a significant and continuous upward trend in sales performance over this five-year period. The Sales Revenue started at 40 billion USD in 2021. It then increased to 42 billion USD in 2022 and 45 billion USD in 2023. The upward trend is projected to continue strongly, reaching 48 billion USD in 2024 and peaking at 50 billion USD in 2025. The total projected increase in sales revenue is 10 billion USD ($\mathbf{50 \text{ billion USD} - 40 \text{ billion USD} = 10 \text{ billion USD}}$) from 2021 to 2025. This consistent growth suggests that increased marketing investment and strategic shifts are effectively boosting overall sales revenue for US retailers.
| Labels | Sales Revenue (USD billions) |
| 2025 | 50 |
| 2024 | 48 |
| 2023 | 45 |
| 2022 | 42 |
| 2021 | 40 |


