Free US E-commerce Platform Ad Spend Share from 2018 to 2025 Charts
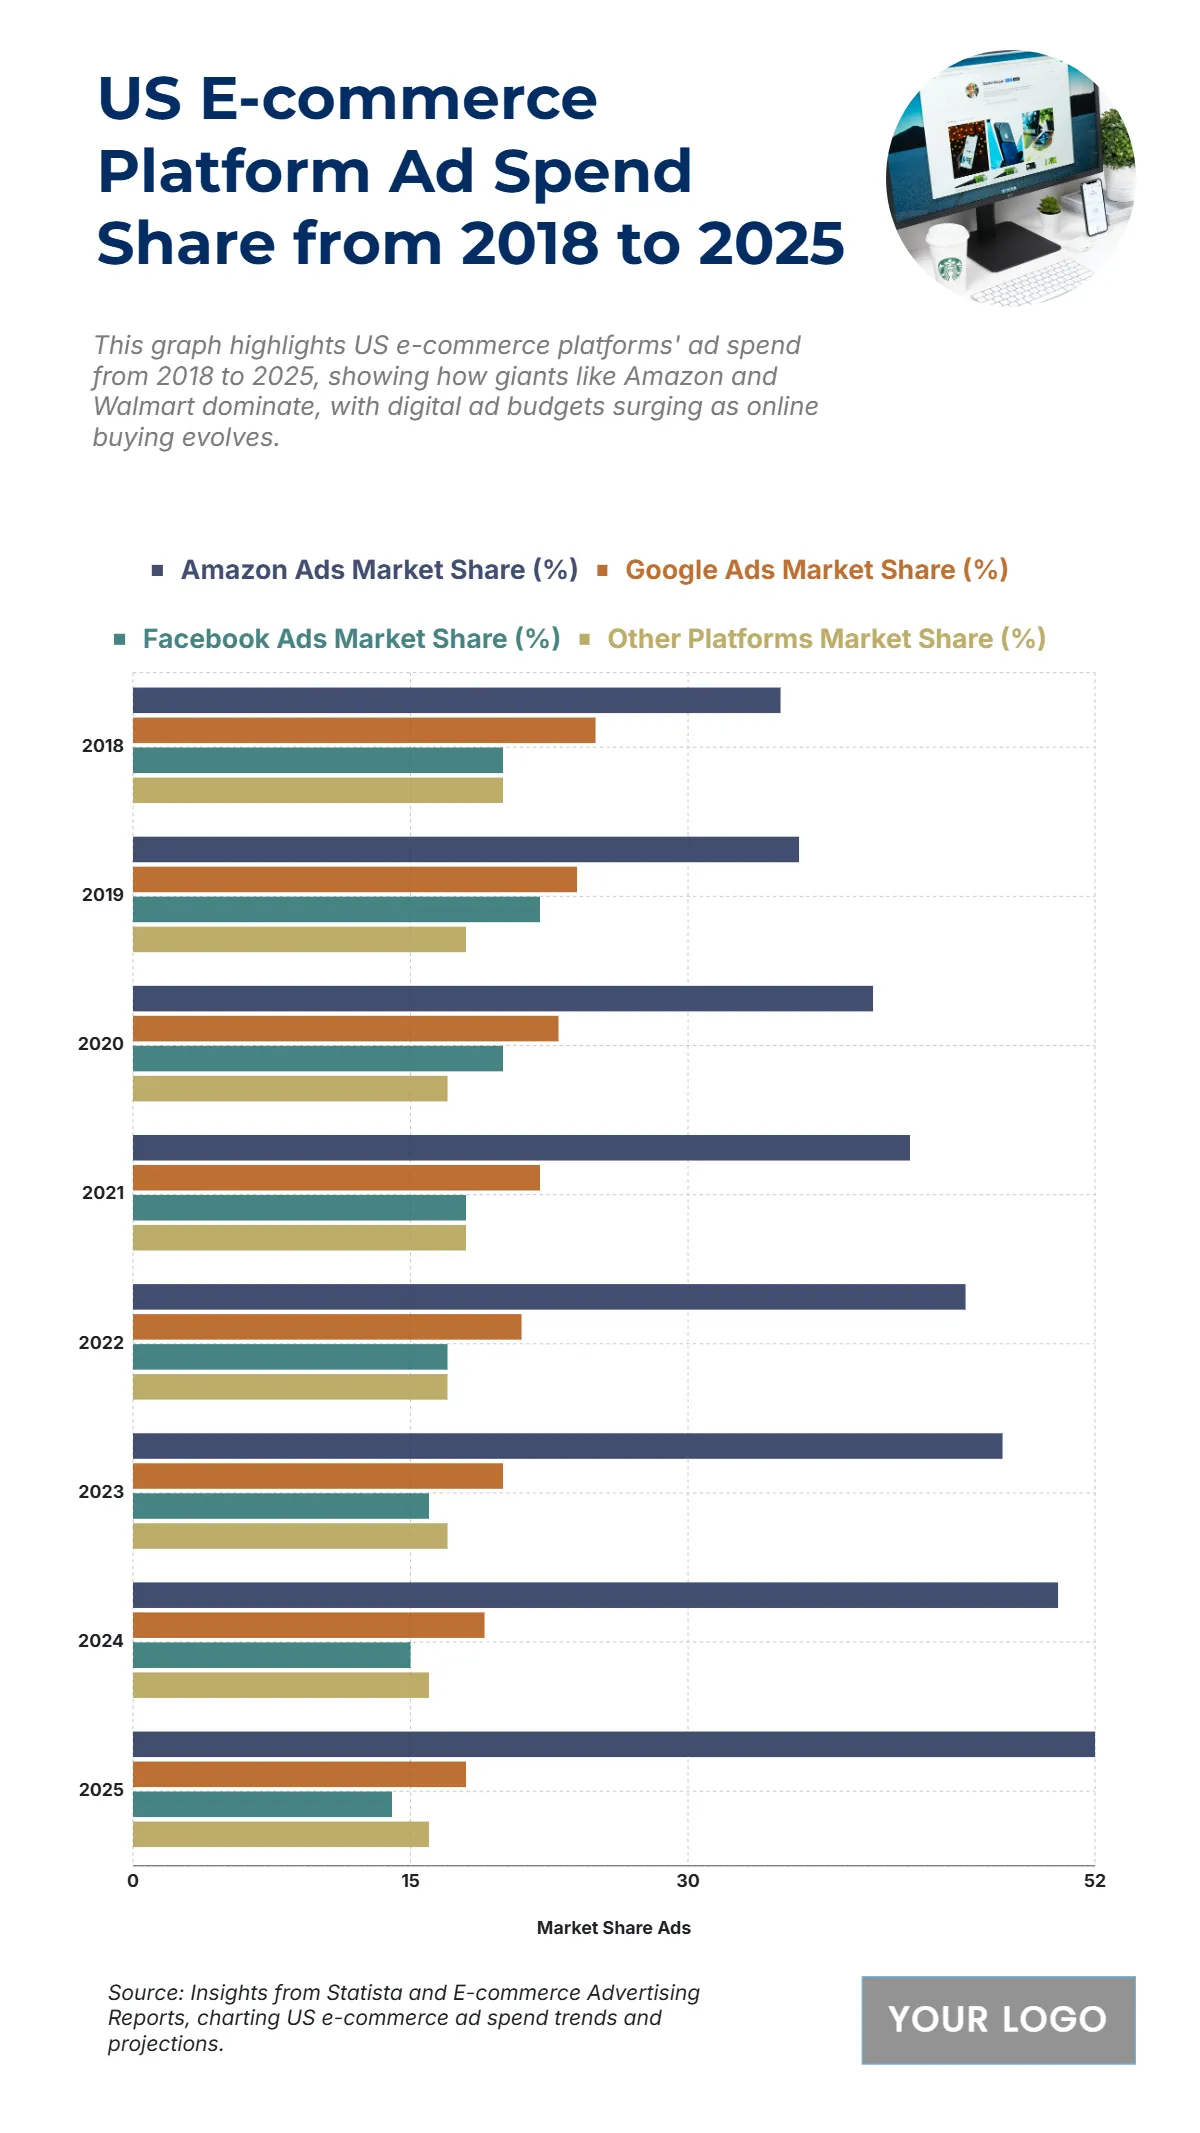
The chart displays the US E-commerce Platform Ad Spend Share (%) from 2018 to 2025, illustrating a dramatic rise in the market share of Amazon Ads at the expense of Google Ads and Facebook Ads. Amazon Ads Market Share (%) is the highest and fastest-growing, starting at 35% in 2018 and projected to reach 52% in 2025. Conversely, Google Ads Market Share (%) shows a consistent decline, falling from 25% in 2018 to 18% in 2025. Facebook Ads Market Share (%) also decreased over the period, dropping from 20% in 2018 to 14% in 2025, with a slight increase to 22% in 2019. The share held by Other Platforms Market Share (%) remained relatively stable, fluctuating between 16% and 20%. The data highlights the profound shift of e-commerce ad budgets to Amazon, which, by 2025, is projected to command more than half of the market share, dwarfing the combined share of Google Ads and Facebook Ads at 32%.
| Labels | Amazon Ads Market Share (%) | Google Ads Market Share (%) | Facebook Ads Market Share (%) | Other Platforms Market Share (%) |
| 2018 | 35 | 25 | 20 | 20 |
| 2019 | 36 | 24 | 22 | 18 |
| 2020 | 40 | 23 | 20 | 17 |
| 2021 | 42 | 22 | 18 | 18 |
| 2022 | 45 | 21 | 17 | 17 |
| 2023 | 47 | 20 | 16 | 17 |
| 2024 | 50 | 19 | 15 | 16 |
| 2025 | 52 | 18 | 14 | 16 |


