Free US Retailer Advertising Spend Distribution from 2018 to 2025 Chart
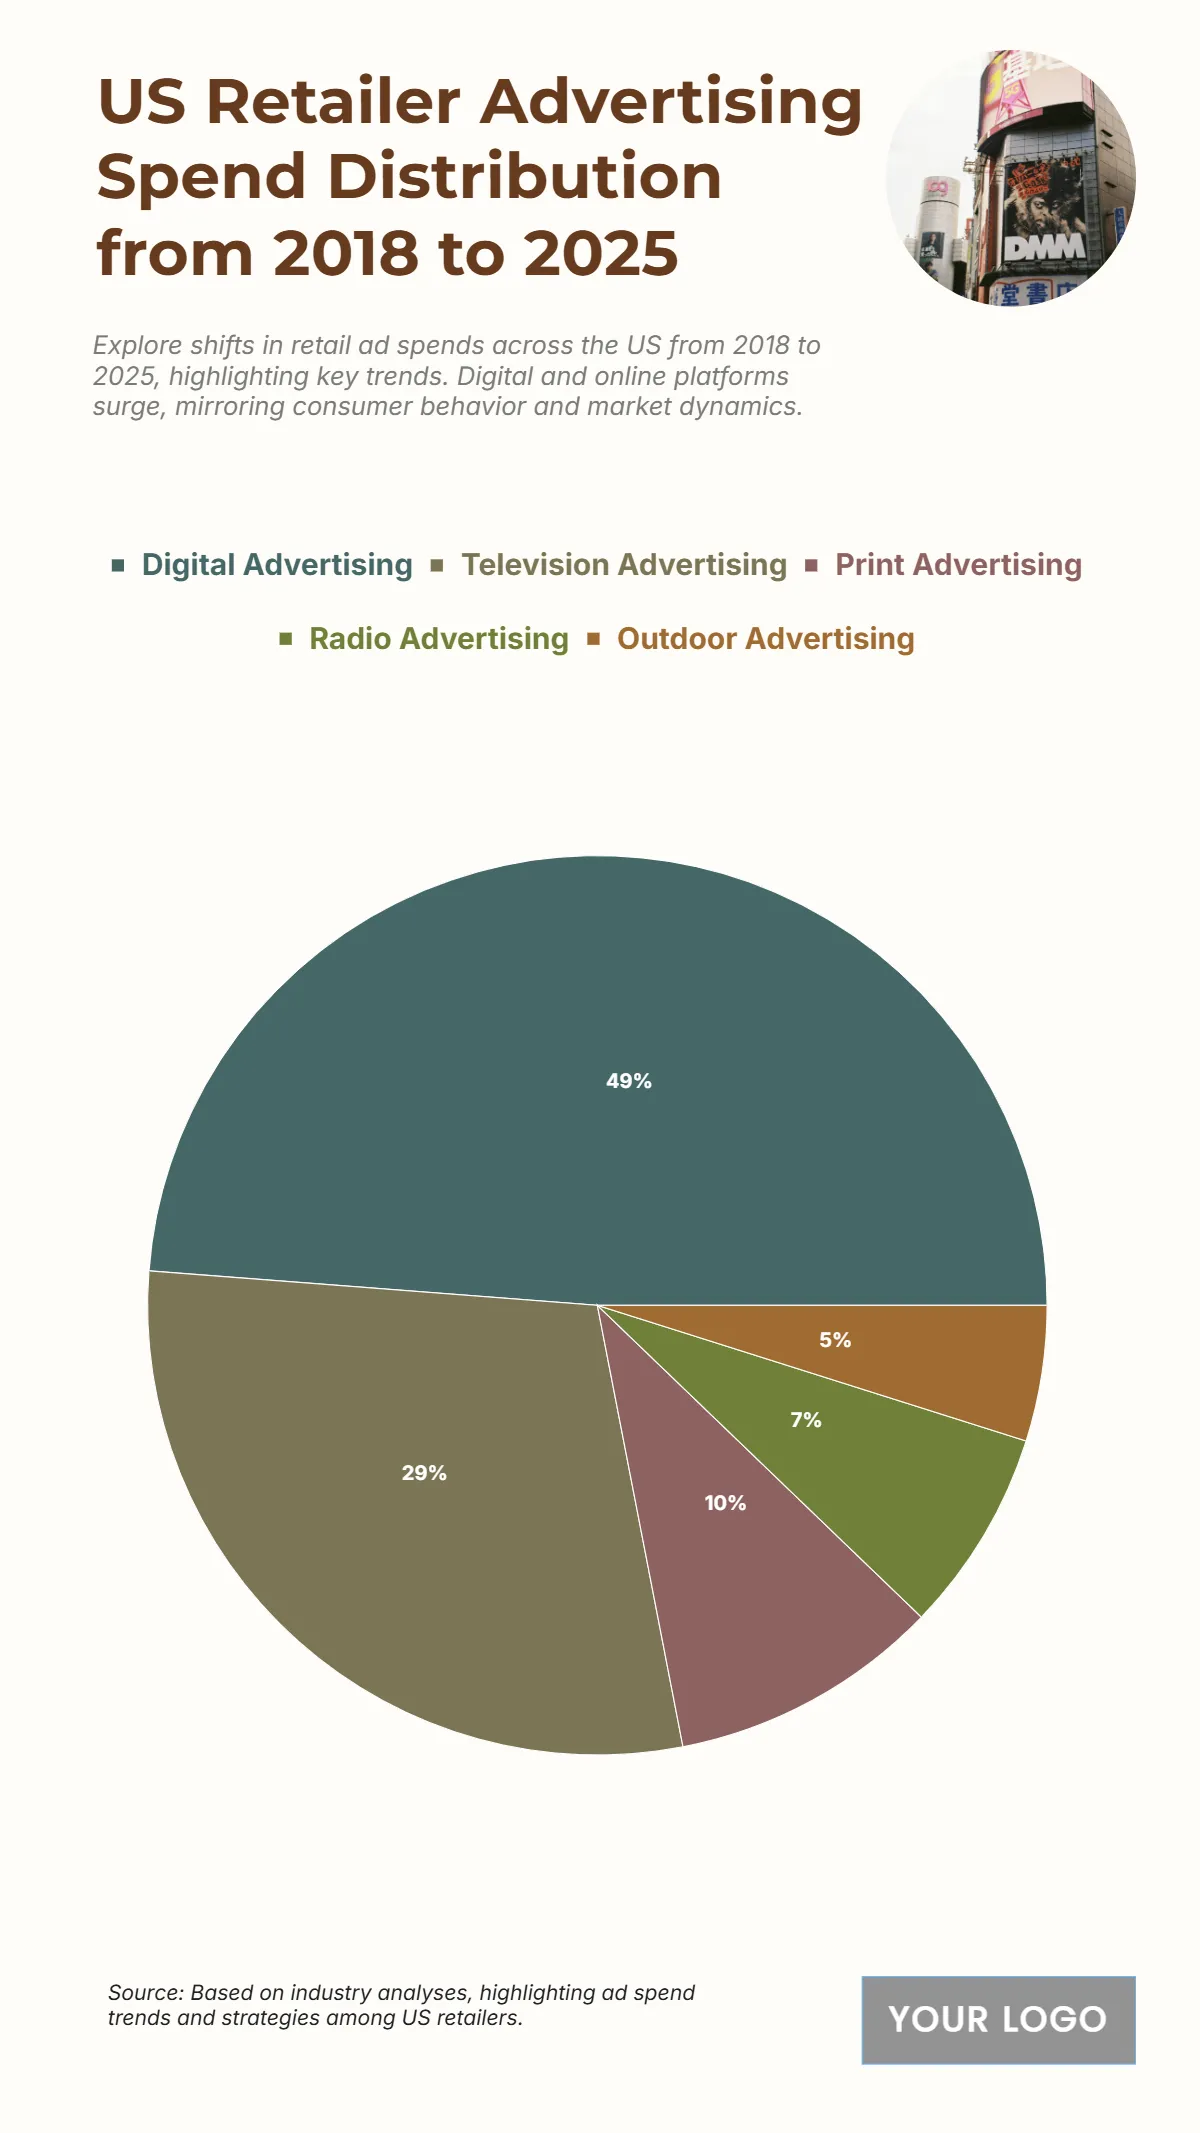
The chart displays the US Retailer Advertising Spend Distribution from 2018 to 2025 across five media channels, illustrating the clear dominance of digital platforms in retail ad spending. Digital Advertising commands the largest share of the ad budget at 48%. Television Advertising follows as the second-largest medium, accounting for 29%. Print Advertising represents 10% of the total spend. Radio Advertising and Outdoor Advertising account for the smallest shares, with Radio at 7% and Outdoor at 5%. Based on the implied total advertising spend of $205 million (the sum of the provided data), Digital Advertising receives 100 million USD. Television Advertising receives 60 million USD. Print Advertising receives 20 million USD. Radio Advertising receives 15 million USD, and Outdoor Advertising receives 10 million USD. The combined share of Digital and Television advertising is 77% ($\mathbf{48\% + 29\% = 77\%}$), underscoring the shift of US retailer budgets toward these two dominant channels, with Digital nearly equal to the combined share of all traditional channels ($\mathbf{48\%}$ digital vs. $\mathbf{52\%}$ traditional).
| Labels | Advertising Spend ($ millions) | Percentage Share (%) |
| Digital Advertising | 100 | 48 |
| Television Advertising | 60 | 29 |
| Print Advertising | 20 | 10 |
| Radio Advertising | 15 | 7 |
| Outdoor Advertising | 10 | 5 |


