Free US Retail Advertising ROI by Platform from 2015 to 2025 Chart
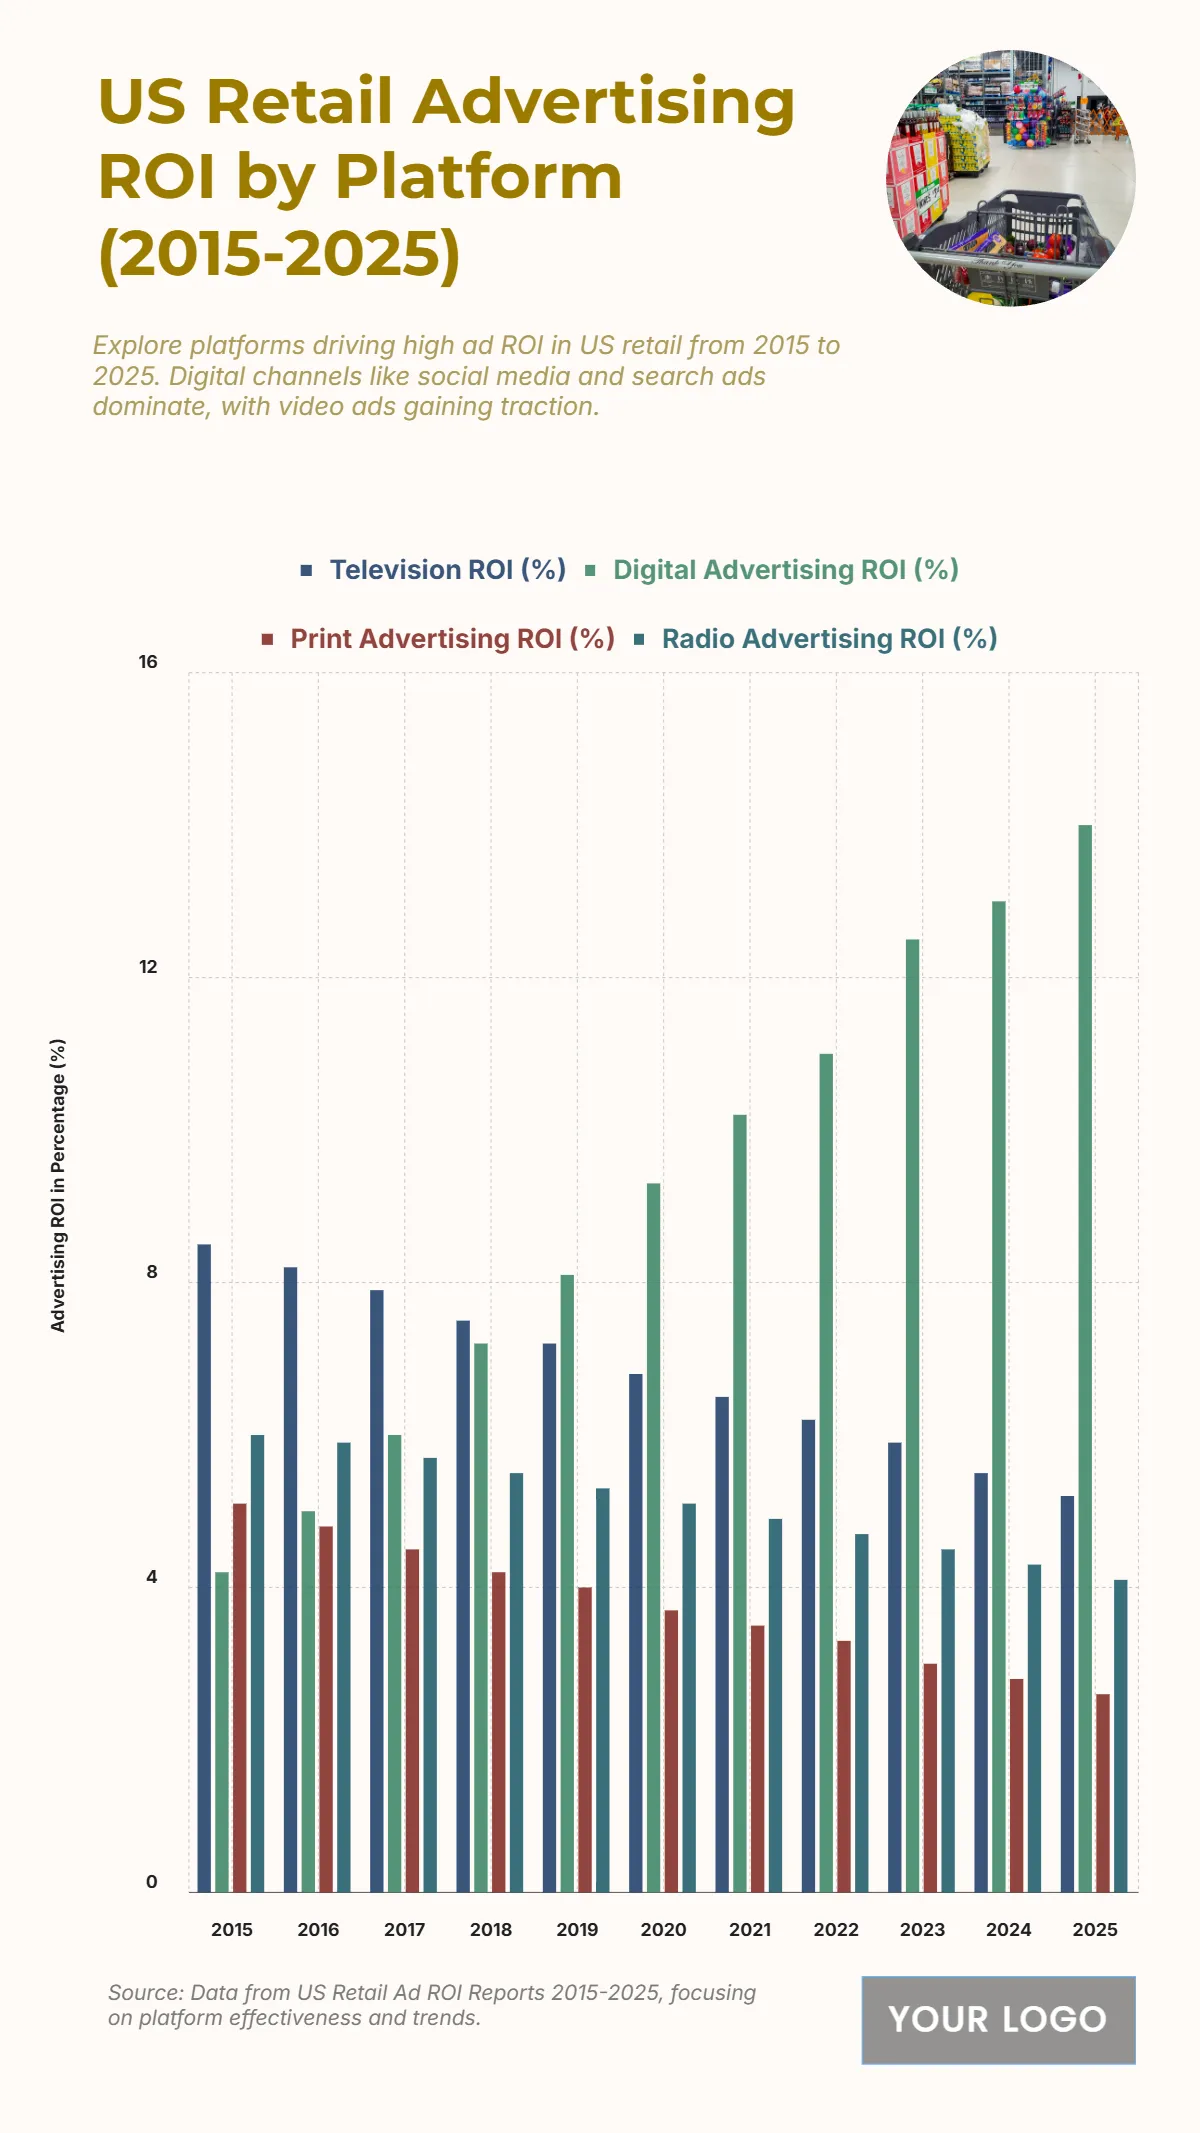
The chart displays the US Retail Advertising ROI (%) by Platform from 2015 to 2025, illustrating a significant and continuous shift in investment return from traditional to digital channels. Digital Advertising ROI (%) is the highest and fastest-growing metric, soaring from 4.2% in 2015 to a projected 14% in 2025. Television ROI (%) and Print Advertising ROI (%) both show consistent declines, with Television falling from 8.5% to 5.2% and Print Advertising dropping sharply from 5.1% to 2.6% in 2025. Radio Advertising ROI (%) also decreases, moving from 6% to 4.1%. The crossover point, where Digital Advertising ROI is projected to surpass Television ROI, occurs between 2019 and 2020, cementing digital's superior financial performance in retail advertising.
| Labels | Television ROI (%) | Digital Advertising ROI (%) | Print Advertising ROI (%) | Radio Advertising ROI (%) |
| 2015 | 8.5 | 4.2 | 5.1 | 6 |
| 2016 | 8.2 | 5 | 4.8 | 5.9 |
| 2017 | 7.9 | 6 | 4.5 | 5.7 |
| 2018 | 7.5 | 7.2 | 4.2 | 5.5 |
| 2019 | 7.2 | 8.1 | 4 | 5.3 |
| 2020 | 6.8 | 9.3 | 3.7 | 5.1 |
| 2021 | 6.5 | 10.2 | 3.5 | 4.9 |
| 2022 | 6.2 | 11 | 3.3 | 4.7 |
| 2023 | 5.9 | 12.5 | 3 | 4.5 |
| 2024 | 5.5 | 13 | 2.8 | 4.3 |
| 2025 | 5.2 | 14 | 2.6 | 4.1 |


