Free US Consumer Ad Recall by Media Channel from 2015 to 2025 Chart
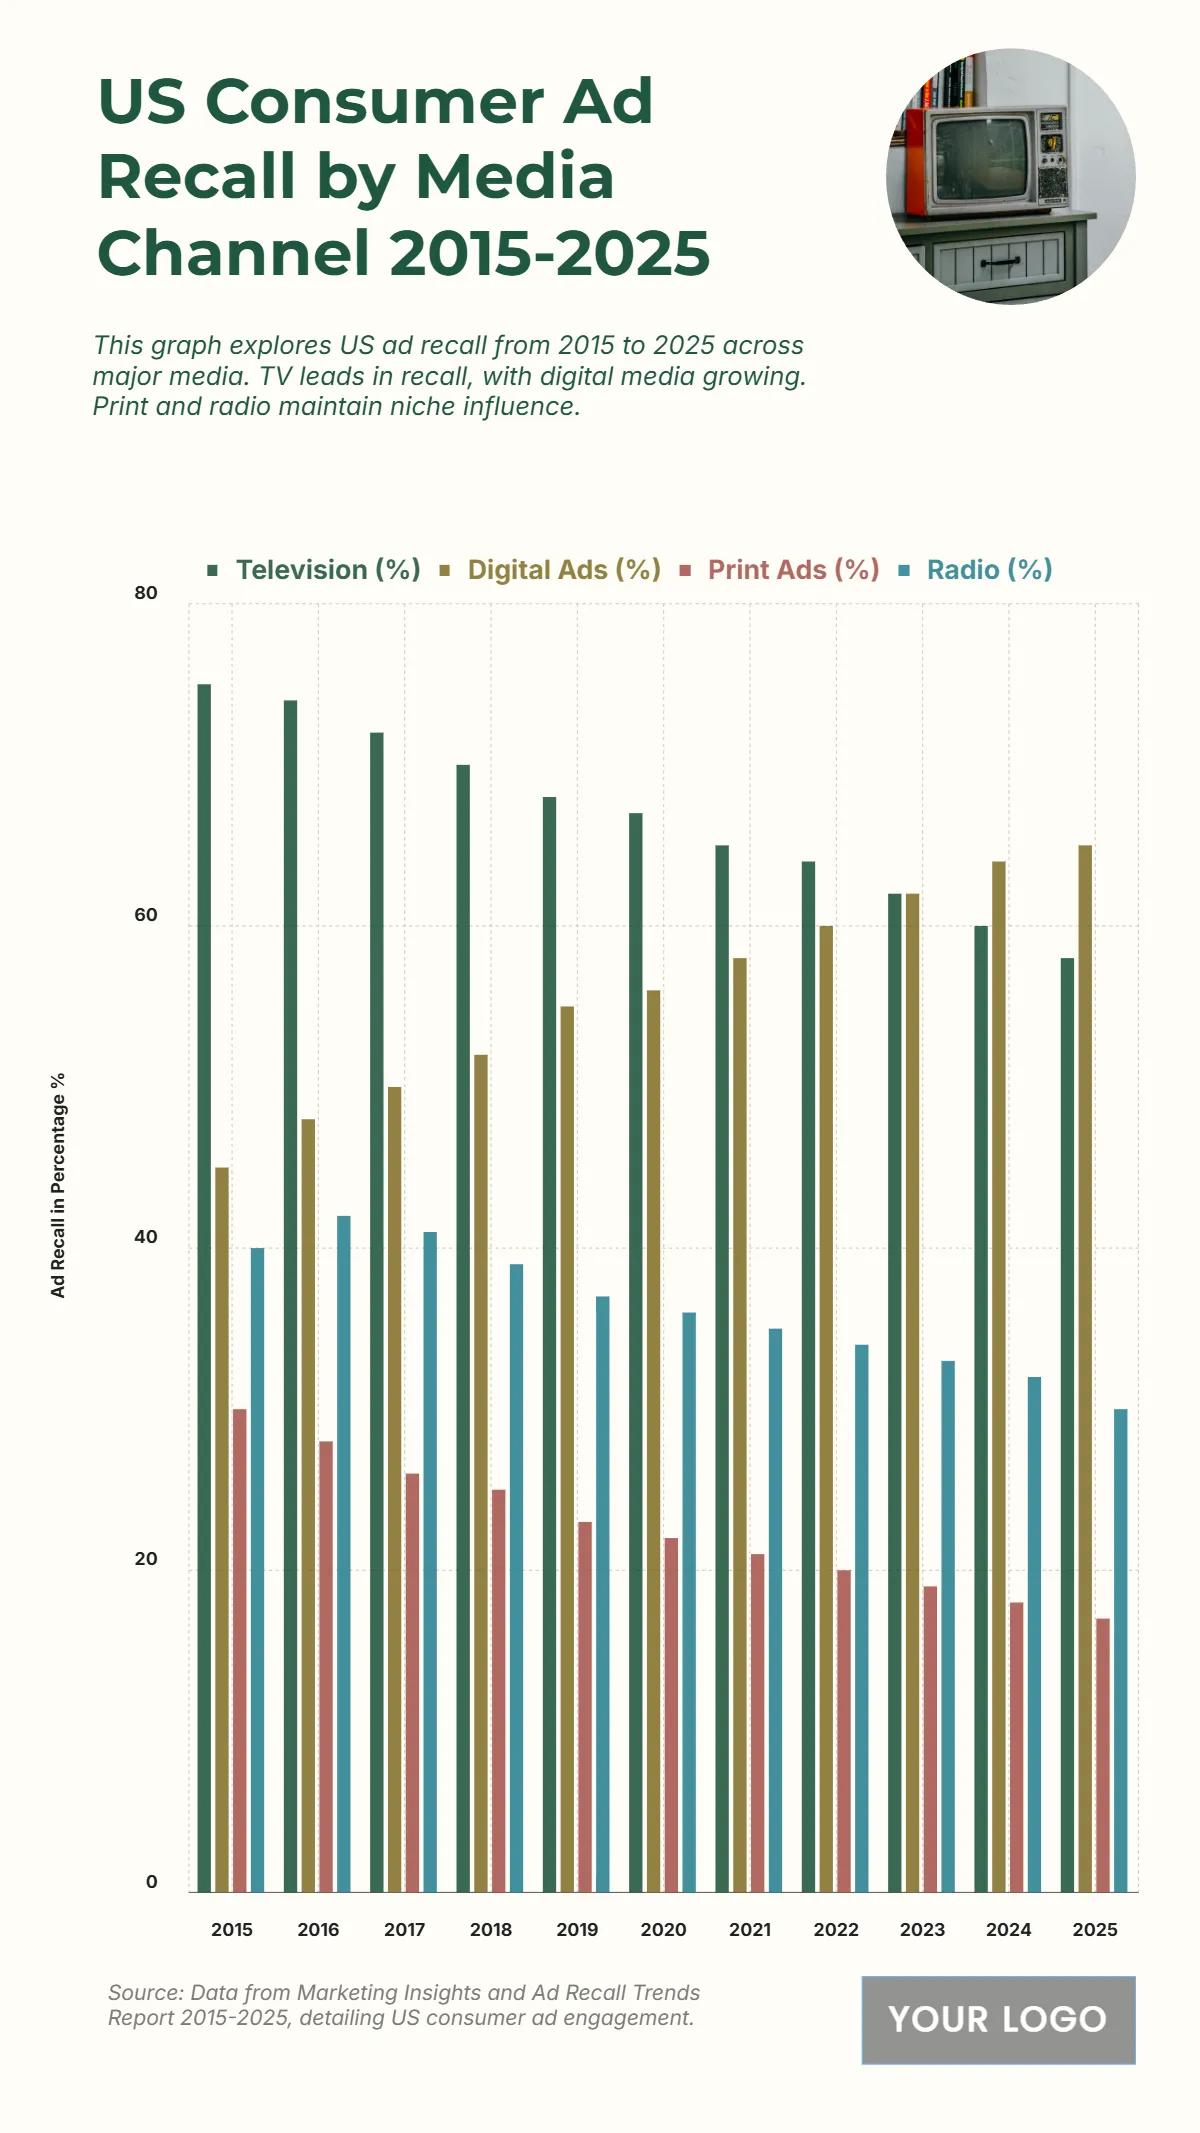
The chart displays the US Consumer Ad Recall by Media Channel from 2015 to 2025 in percentages, illustrating a significant shift in recall effectiveness from Television (%) to Digital Ads (%) over the decade. Television (%) Ad Recall consistently declines, falling from 75% in 2015 to 58% in 2025. Conversely, Digital Ads (%) Ad Recall shows a continuous and substantial increase, rising from 45% in 2015 to 65% in 2025. The crossover point, where Digital Ads recall is projected to surpass Television recall, occurs between 2022 and 2023 as both reach 62%. Radio (%) Ad Recall slowly declines from 40% to 30%, and Print Ads (%) Ad Recall drops from 30% to 17% in 2025. The data highlights the profound evolution of ad engagement, with Digital Ads becoming the leading channel for consumer ad recall by the end of the period.
| Labels | Television (%) | Digital Ads (%) | Print Ads (%) | Radio (%) |
| 2015 | 75 | 45 | 30 | 40 |
| 2016 | 74 | 48 | 28 | 42 |
| 2017 | 72 | 50 | 26 | 41 |
| 2018 | 70 | 52 | 25 | 39 |
| 2019 | 68 | 55 | 23 | 37 |
| 2020 | 67 | 56 | 22 | 36 |
| 2021 | 65 | 58 | 21 | 35 |
| 2022 | 64 | 60 | 20 | 34 |
| 2023 | 62 | 62 | 19 | 33 |
| 2024 | 60 | 64 | 18 | 32 |
| 2025 | 58 | 65 | 17 | 30 |


