AI
Marketing
Print
Document
Templates
Business
Categories
Marketing
Document
Free US Retailer Digital Ad Conversion Benchmarks by Region from 2015 to 2025 Chart

- 100% Customizable, free editor
- Access 1 Million+ Templates, photo’s & graphics
- Download or share as a template
- Click and replace photos, graphics, text, backgrounds
- Resize, crop, AI write & more
- Access advanced editor
AI AI Chart and Graph Generator
Generate my free AI Chart and Graph Text or voice to generate a free AI Chart and Graph
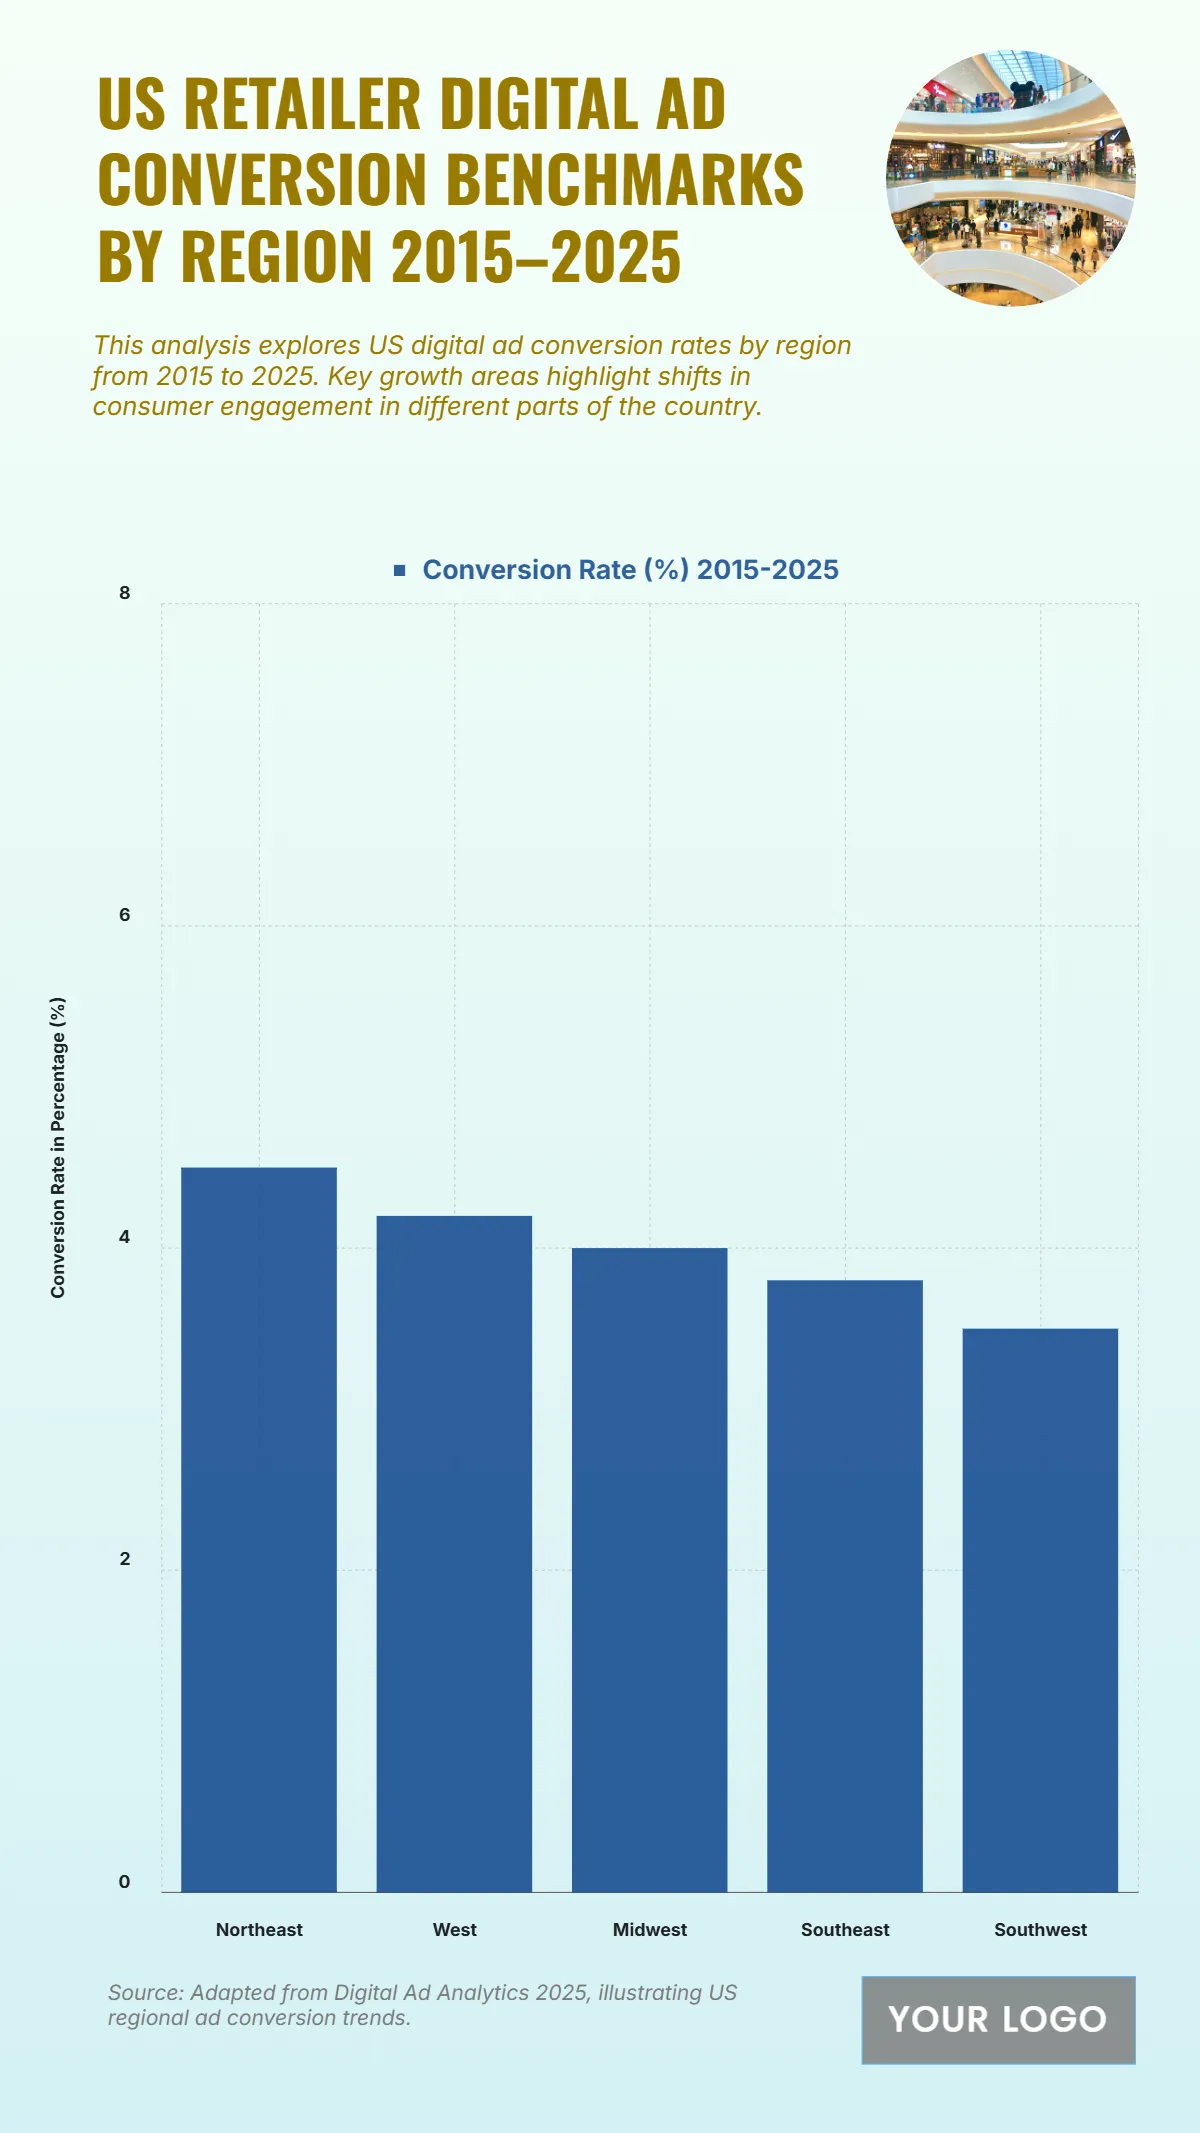
The chart displays the US Retailer Digital Ad Conversion Rate (%) from 2015 to 2025 by region, illustrating a varied but generally high conversion effectiveness across US regions. The Northeast leads the nation with the highest conversion rate at 4.5%. The West follows closely with 4.2%. The Midwest has a conversion rate of 4%. The Southeast and Southwest have the lowest rates among the listed regions, with the Southeast at 3.8% and the Southwest at 3.5%. The difference between the highest-converting region (Northeast) and the lowest-converting region (Southwest) is 1 percentage point ($\mathbf{4.5\% - 3.5\% = 1\%}$), suggesting regional differences in consumer engagement and ad targeting effectiveness.
| Labels | Conversion Rate (%) 2015–2025 |
| Northeast | 4.5 |
| West | 4.2 |
| Midwest | 4 |
| Southeast | 3.8 |
| Southwest | 3.5 |
You may also like
- Bar Graph Chart
- Line Graph Chart
- Pie Graph Chart
- Table Graph Chart
- Scatter Graph Chart
- Area Graph Chart
- Tree Graph Chart
- Birth Chart
- Chore Chart
- Time Table Chart
- Dress Size Chart
- Football Depth Chart
- Color Chart
- Color Wheel Chart
- Color Mix Chart
- Classroom Seating Chart
- Church Organizational Chart
- Hierarchy Organizational Chart
- Tree Organizational Chart
- Organization Chart
- Time Chart
- Blood Pressure Chart
- Behavior Chart
- Process Flowchart
- Process Flow Chart
- Baby Feeding Chart
- BMI Chart
- Ring Size Chart
- Height Chart
- Number Chart
- Food Chart
- Baby Milestones Chart
- Blood Sugar Chart
- Body Temperature Chart
- Diet Chart
- Metric Chart
- Pregnancy Weight Gain Chart
- HCG Levels Chart
- Astrology Chart
- Blood Oxygen Level Chart
- Gauge Chart
- Sales Chart
- Marketing Chart
- Military Time Chart
- Pregnancy Food Chart
- Medical Chart
- Wedding Seating Chart
- Guitar Chord Chart
- Pedigree Chart
- Natal Chart
- Team Organizational Chart
- Feelings Chart
- Piano Chord Chart
- Shoe Size Chart
- Activity Chart
- Height Weight
- Eye Chart
- Chakra Chart
- Reflexology Chart
- Hospital Organizational Chart
- Radar Chart
- College Organizational Chart
- Column Chart
- Roman Numerals Chart
- Weather Chart
- Height Conversion Chart
- Food Calorie Chart
- Fundraising Chart
- Kids Chore Chart
- Donut Chart
- Incident Flow Chart
- Patient Chart
- Body Measurement Chart
- Synastry Chart
- Funnel Chart
- Goal Chart
- Weight Loss Chart
- Money Chart
- Research FlowChart
- Medical Organizational Chart
- Protein Chart
- Retail Organizational Chart
- Sports Organizational Chart
- Vitamin Chart
- Research Gantt Chart
- To Do Chart
- Tooth Chart
- Conjugation Chart
- Drug Chart
- Event FlowChart
- Gildan Size Chart
- Logistics Organizational Chart
- Production FlowChart
- Bank Organizational Chart
- Dental Chart
- Dissertation Gantt Chart
- Training Gantt Chart
- Warehouse Organizational Chart
- Army Weight Chart
- Communication FlowChart
- Face Chart
- Pharma Organizational Chart
- Travel Gantt Chart
- Gaming FlowChart
- Insurance Organizational Chart
- Manufacturing Chart
- Progress Chart
- Travel Organizational Chart
- Charity FlowChart
- Design Firm/Company Organizational Chart
- Hospital Gantt Chart
- Manufacturing Gantt Chart
- Recruitment Gantt Chart
- Website Gantt Chart
- Environment Organizational Chart
- Fire Organizational Chart


