How to Create a Gantt Chart in Excel Easily – Tutorial
How to create a Gantt chart in Excel tutorial below will help you to simplify the step by step of it. The Gantt chart is usually used for project management. Some people may call it as a horizontal bar chart. This Gantt Chart Template is very popular with the horizontal lines that mention the completed work or other activities.

Gantt is essentially a production control tool which was founded by an American engineer and social scientist, Henry L. Gantt in the year 1917. Over the decade or so, MS Excel has become an integral application and its popularity and utility in projects – personal and professional – continues to increase significantly. The reason that was mentioned is because MS Excel was used to create this Gantt chart sample.
Because people always want everything in easier way, then here we go: the easier way to create the Gantt chart.
Step 1: Do the Project Tasks
- Write down your whole projects into the phases until you see your Gantt chart template.
- Enter the data by creating list of the Start Date, Finish Date and the duration on each task (It belongs to Excel 2007, 2010 and 2013).
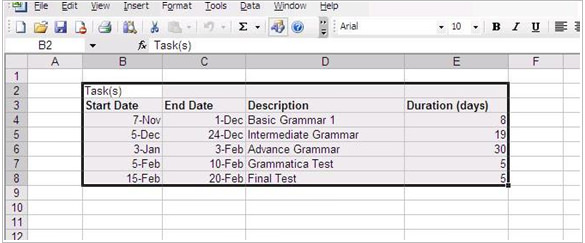
Step 2: First after your Gantt Chart is on, Start Setting it up to the Stacked Bar Chart
- Click the blank cell on the same worksheet.
- Select insert tab (from the Excel ribbon).
- Drop down the Bar Chart menu (from the Excel ribbon).
- Click the Stacked Bar. This will cause inserting the large blank white chart to your worksheet. So, avoid selecting 100% of the Stacked Bar).
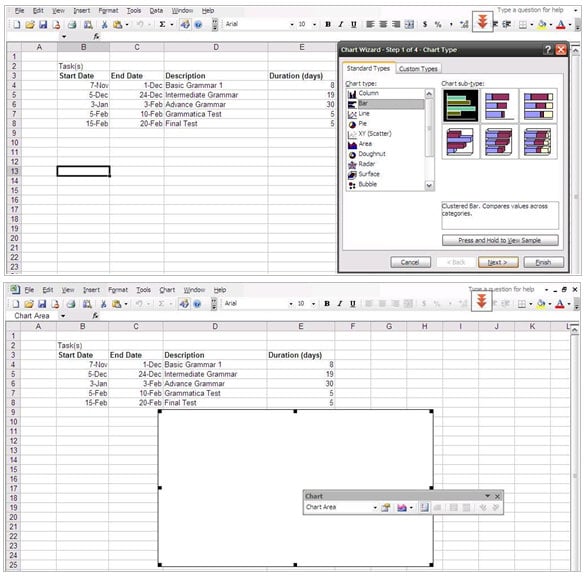
Step 3: Add your data on your Gantt chart
- On the white chart space, do the right-click and select data. It will catch up the data source window of your Excel worksheet.
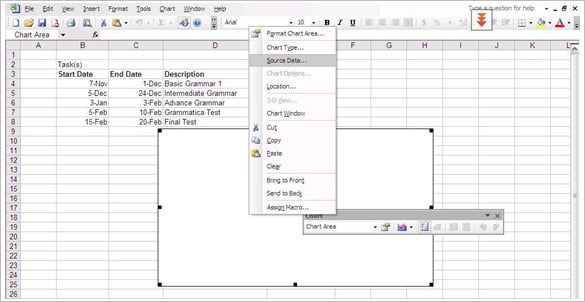
- See the left side of the data source window and look at Legend Entries. Click “Add” and it will be shown the Edit Series window to start adding your data into your Gantt chart template sample.
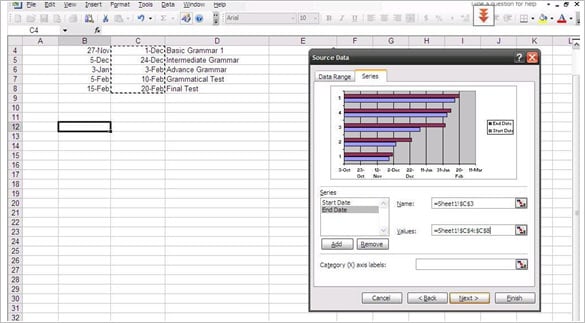
Start Adding your Data
- Name your data (Series) by clicking your cursor in the empty space (it is located under the Series Name). Click on the column header which has Start Date in the table.
- Move down to the next step, which is the Series Value. The Task starts to be entered here. A spreadsheet with a little red arrow will be seen on the right of Series values. While opening the Series Values, there will be a smaller Edit Series window. Then, click the first start date and drag it into the last one. It creates highlights that will copy your tasks into your Gantt chart. Remember not to highlight the header or other mistaken cells.
- After finishing this step, click the icon of small spreadsheet once more.
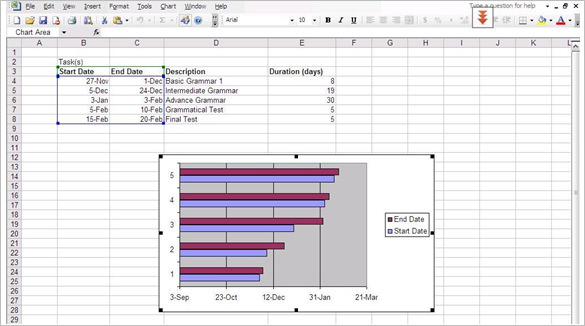
Step 4: Add the Task duration and repeat the explained steps above
While on the Select Data Source window, click the Add button and go to Excel’s Edit Series window. In this step, you can start adding your Task duration by following the third steps.
The duration data is starting to add into the chart
- Click on the empty space on the Edit Series window (under the Series name). Click on the header that shows Duration.
- On the Edit series window, move to the Series value and then click on the icon with a small red arrow. After got finished, click that small icon once more.
- Click your Duration data by the first and drag to the last Duration data. All you Duration data are highlighted. To exit, click the icon with red arrow, click OK while arriving to the previous window and you will get back to the Select Data Source window. For building your Gantt chart, click OK.
Step 5: Formatting your Gantt Chart
Click on the blue part to select all the tasks bars, do the right-click and select the Format Data Series to go to the Format Data Series window.
Stay close on the Format Data Series window and click Fill & Line icon (the icon is similar to the paint cat). Under Fill, select the button of No Fill and No Line (under Border). Remember not to close this Format Data Series because you will still need it.
To reorder your data (the top and bottom chart), try this out:
- Click on the list of your tasks along the vertical axis to select all your tasks.
- For opening the Format Axis, click on the task tittles.
- Put the check into the check box (Categories in reverse order) that is located on the Format Axis which is under the header Axis Options and sub header Axis Positions.


