How to Create a Pie Chart in Microsoft Excel – Tutorial
A pie chart is a statistical tool for demonstrating and showcasing data. It is a circular statistical graph which is divided into segments to show numerical figures. Pie chart segments are equivalent to the quantity represented. It is called a pie chart because of its resemblance to a real life pie. They are very important and are widely in the media and corporate world. They have shortcomings though. Some statisticians argue that it is hard to compare data across several pie charts. However, the pie chart is still valuable for series data.

Some types of Pie Chart are:
- 2D Pie-chart
- 3D Pie-chart
- Exploded Pie-chart
In this article, we will be looking at how to create a pie chart using Microsoft Excel. This is done in six separate steps.
Step 1 – Generate your Data First
Microsoft Excel is an application for managing of spreadsheet data. So it is important that you generate the data, for the sake of this exercise, we shall look at data of allocation of resources in the home for expenses, investment and savings. We will look at the percentages of the allocations.
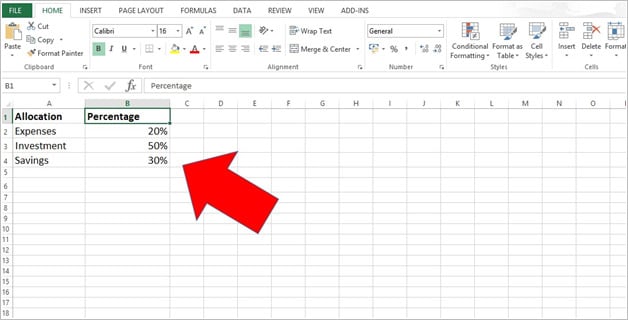
Quick arrangement of this data in a table format will look thus

Step 2 – Enter your Data
In doing this, be mindful of the fact that the fist column will feature a list of items under the allocation heading while the percentages are featured separately under the percentage column. Remember a pie chart can only be used for a simple data series involving only one topic, the topic in this example being Home Finance Management statistics. So when you enter the data in your Excel spreadsheet, it should look like this:

Note how the information is entered in the appropriate columns.
Step 3 – At this point to continue, you must save all the changes to the Spread Sheet Data
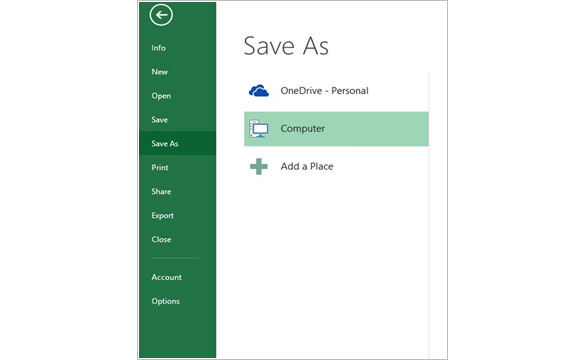
So move your cursor to the file button and click. A dialogue box opens, then select save as and proceed to save the spread sheet document.

Step 4 – Highlight the Data that you need to Create the Pie Chart
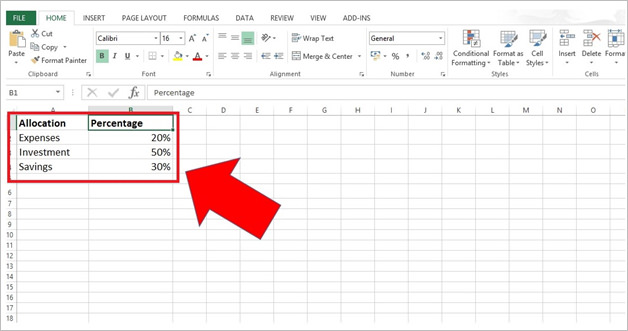
Move your cursor over all the data you earlier inputted in the two columns. Now drag it over both columns and rows and take special care that it does not select another unrelated data series. For instance, if the heading on a column says ”allocation” and the next column header says “ percentages”, then ensure that both information are included to enable the chart app properly analyze and appropriate the data. If any important data is left out, the chart wizard will not be able to create a suitable pie chart template.

Step 5 – Click the Insert Menu
A dialogue box will appear, and then you select the type of chart you want.There are several options including a regular 2D pie chart, an exploded pie chart, and a 3D pie chart, bar of pie chart or pie of pie chart template sample. To have an idea of what each of this types of pie charts looks like there is a special feature. Click the option”press and hold to view sample”. A drop down box will display a review of each type of pie chart. This is how it will look like:


