Free Top 10 Income Brackets in the US with Rising Debt from 2020 to 2025 Chart
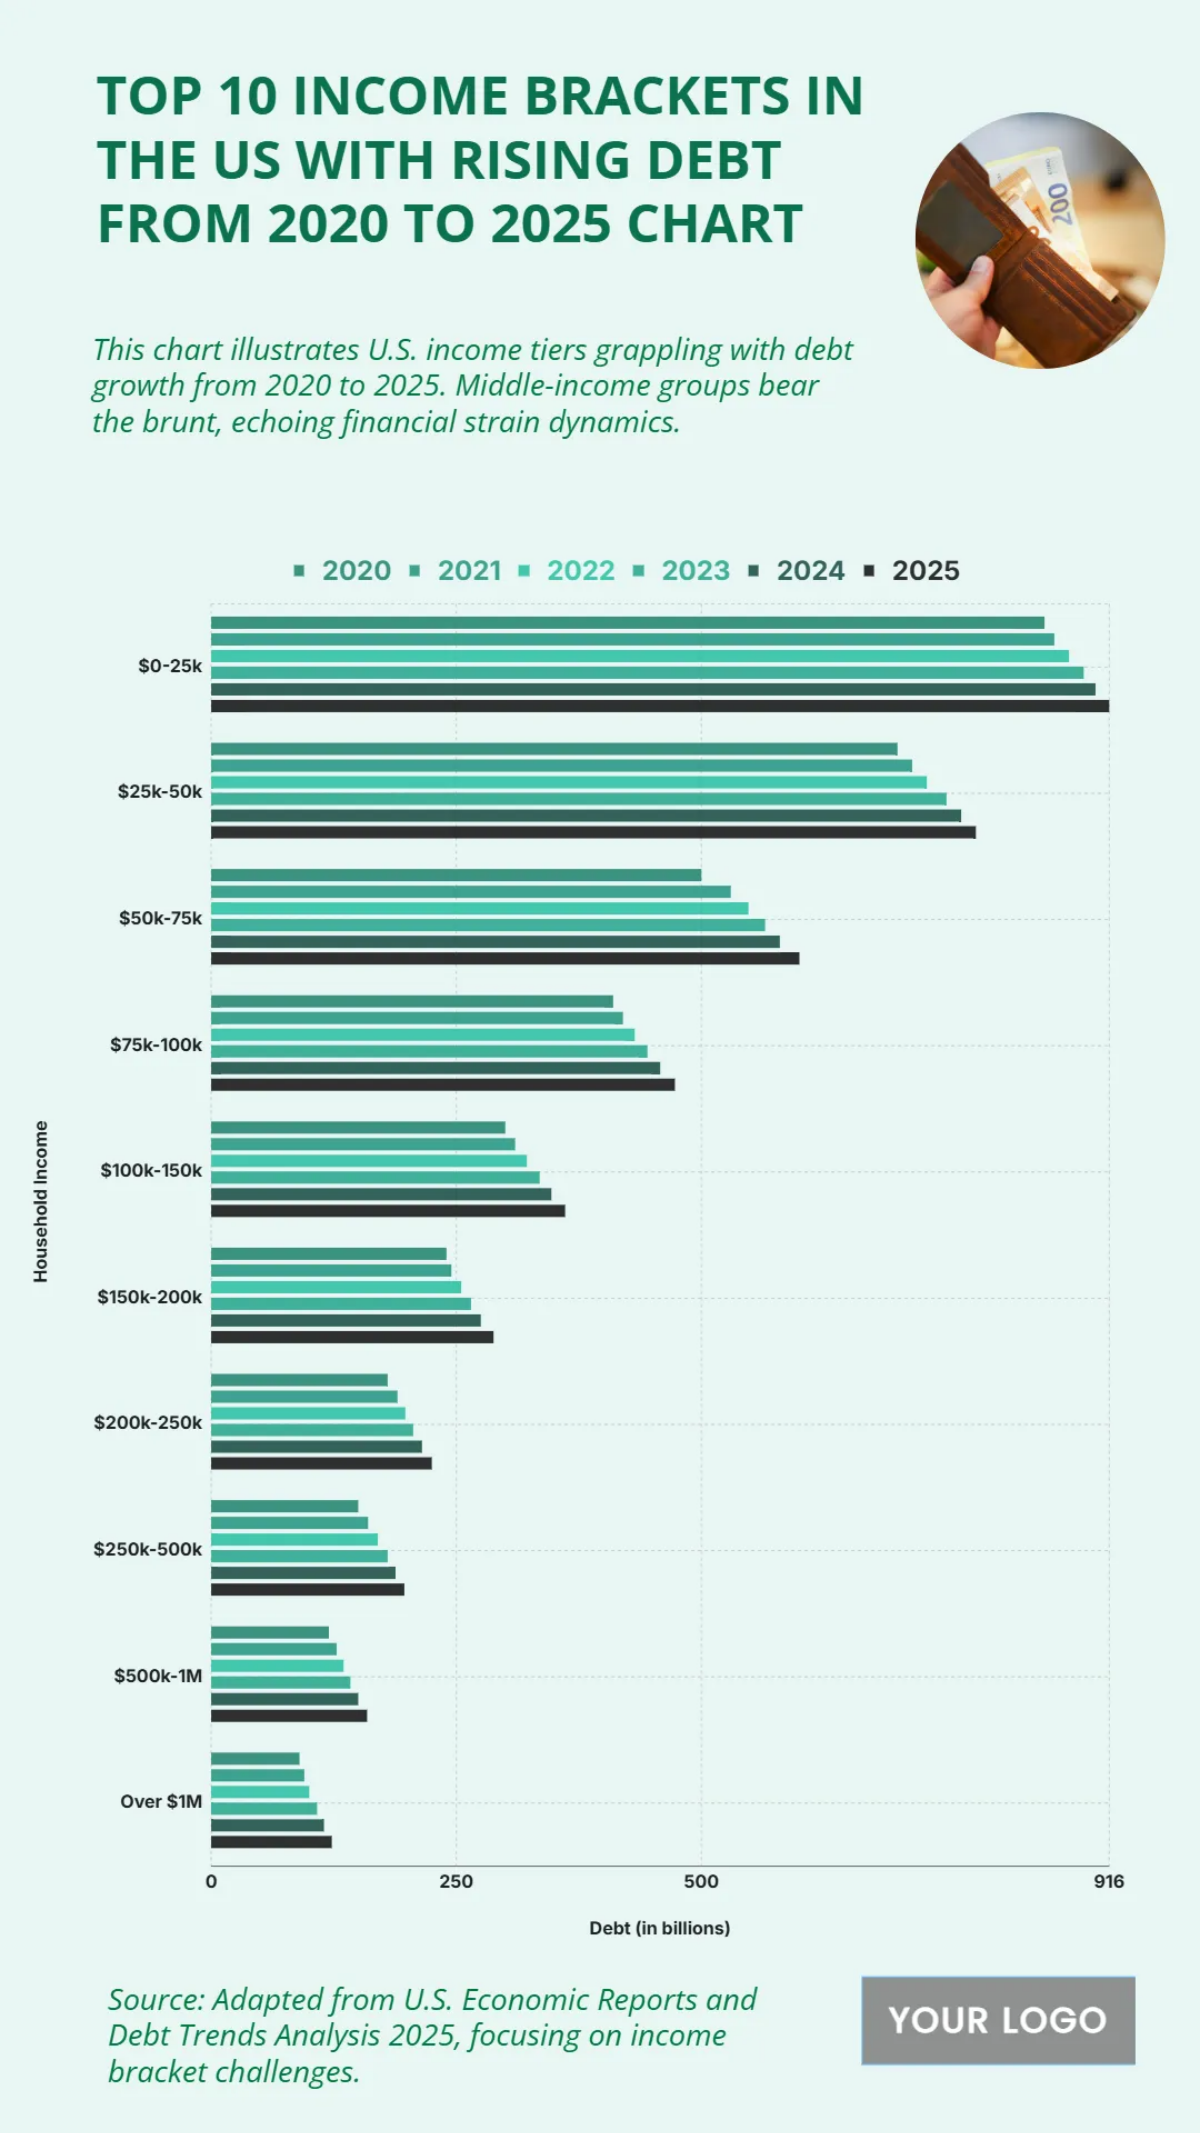
The chart “Top 10 US Income Levels with Rising Debt: 2015–2025” illustrates how debt levels have steadily increased across income brackets. For the lowest group, $20,000–$39,999, debt rose from $40 billion in 2015 to $80 billion in 2020, and is projected to hit $120 billion by 2025. Middle-income groups show sharper growth: households earning $80,000–$99,999 had debt rising from $140 billion in 2015 to $200 billion in 2020, and further to $260 billion in 2025. Higher earners, such as those in the $150,000–$199,999 bracket, saw debt rise from $200 billion in 2015 to $260 billion in 2020, and reaching $320 billion in 2025.
The steepest increase is in the $200,000 and above group, where debt nearly doubles from $220 billion in 2015 to $280 billion in 2020, and climbs further to $360 billion in 2025.
This trend underscores growing financial pressure across all income levels, with middle- and high-income brackets experiencing the most significant debt expansion.


