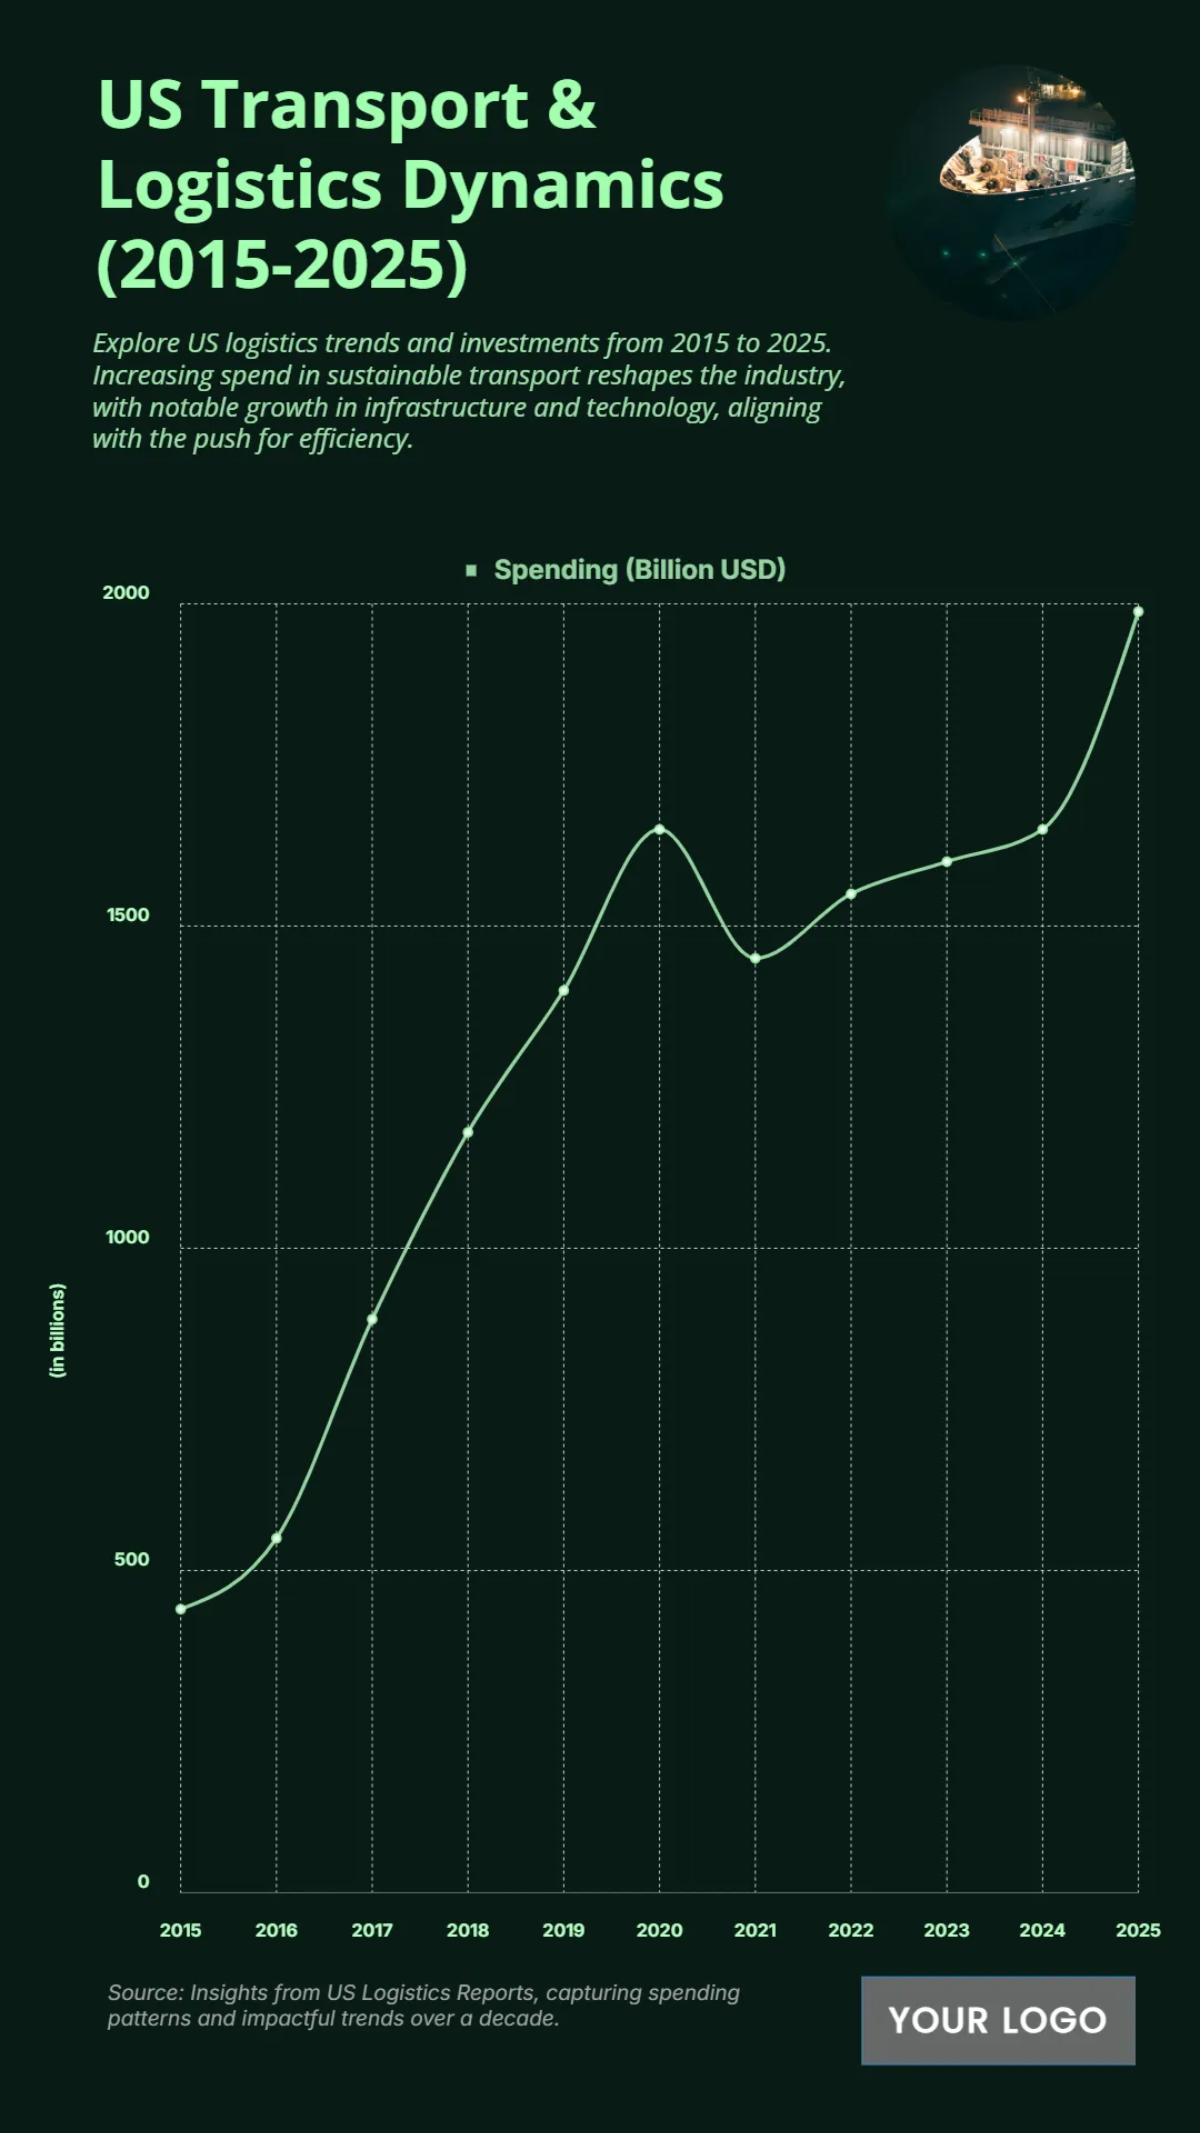
Free US Transportation and Logistics Spending from 2015 to 2025 Chart
The chart “US Transport & Logistics Dynamics (2015–2025)” tracks industry spending over the decade. In 2015, spending stood at about $200 billion, rising steadily to nearly $600 billion in 2017 and surpassing $1 trillion in 2019. A sharp increase occurred in 2020, peaking at around $1.4 trillion, before dipping slightly in 2021 to just above $1.1 trillion. From 2022 onward, spending recovered and climbed again, reaching approximately $1.2 trillion in 2023, $1.4 trillion in 2024, and is projected to hit nearly $2 trillion in 2025.
This growth reflects strong investment in infrastructure, sustainable transport solutions, and technological innovation, even with temporary slowdowns. The long-term trend highlights logistics as a critical driver of U.S. economic efficiency and modernization.


