Free US Credit Card Debt by Age Group from 2015 to 2025 Chart
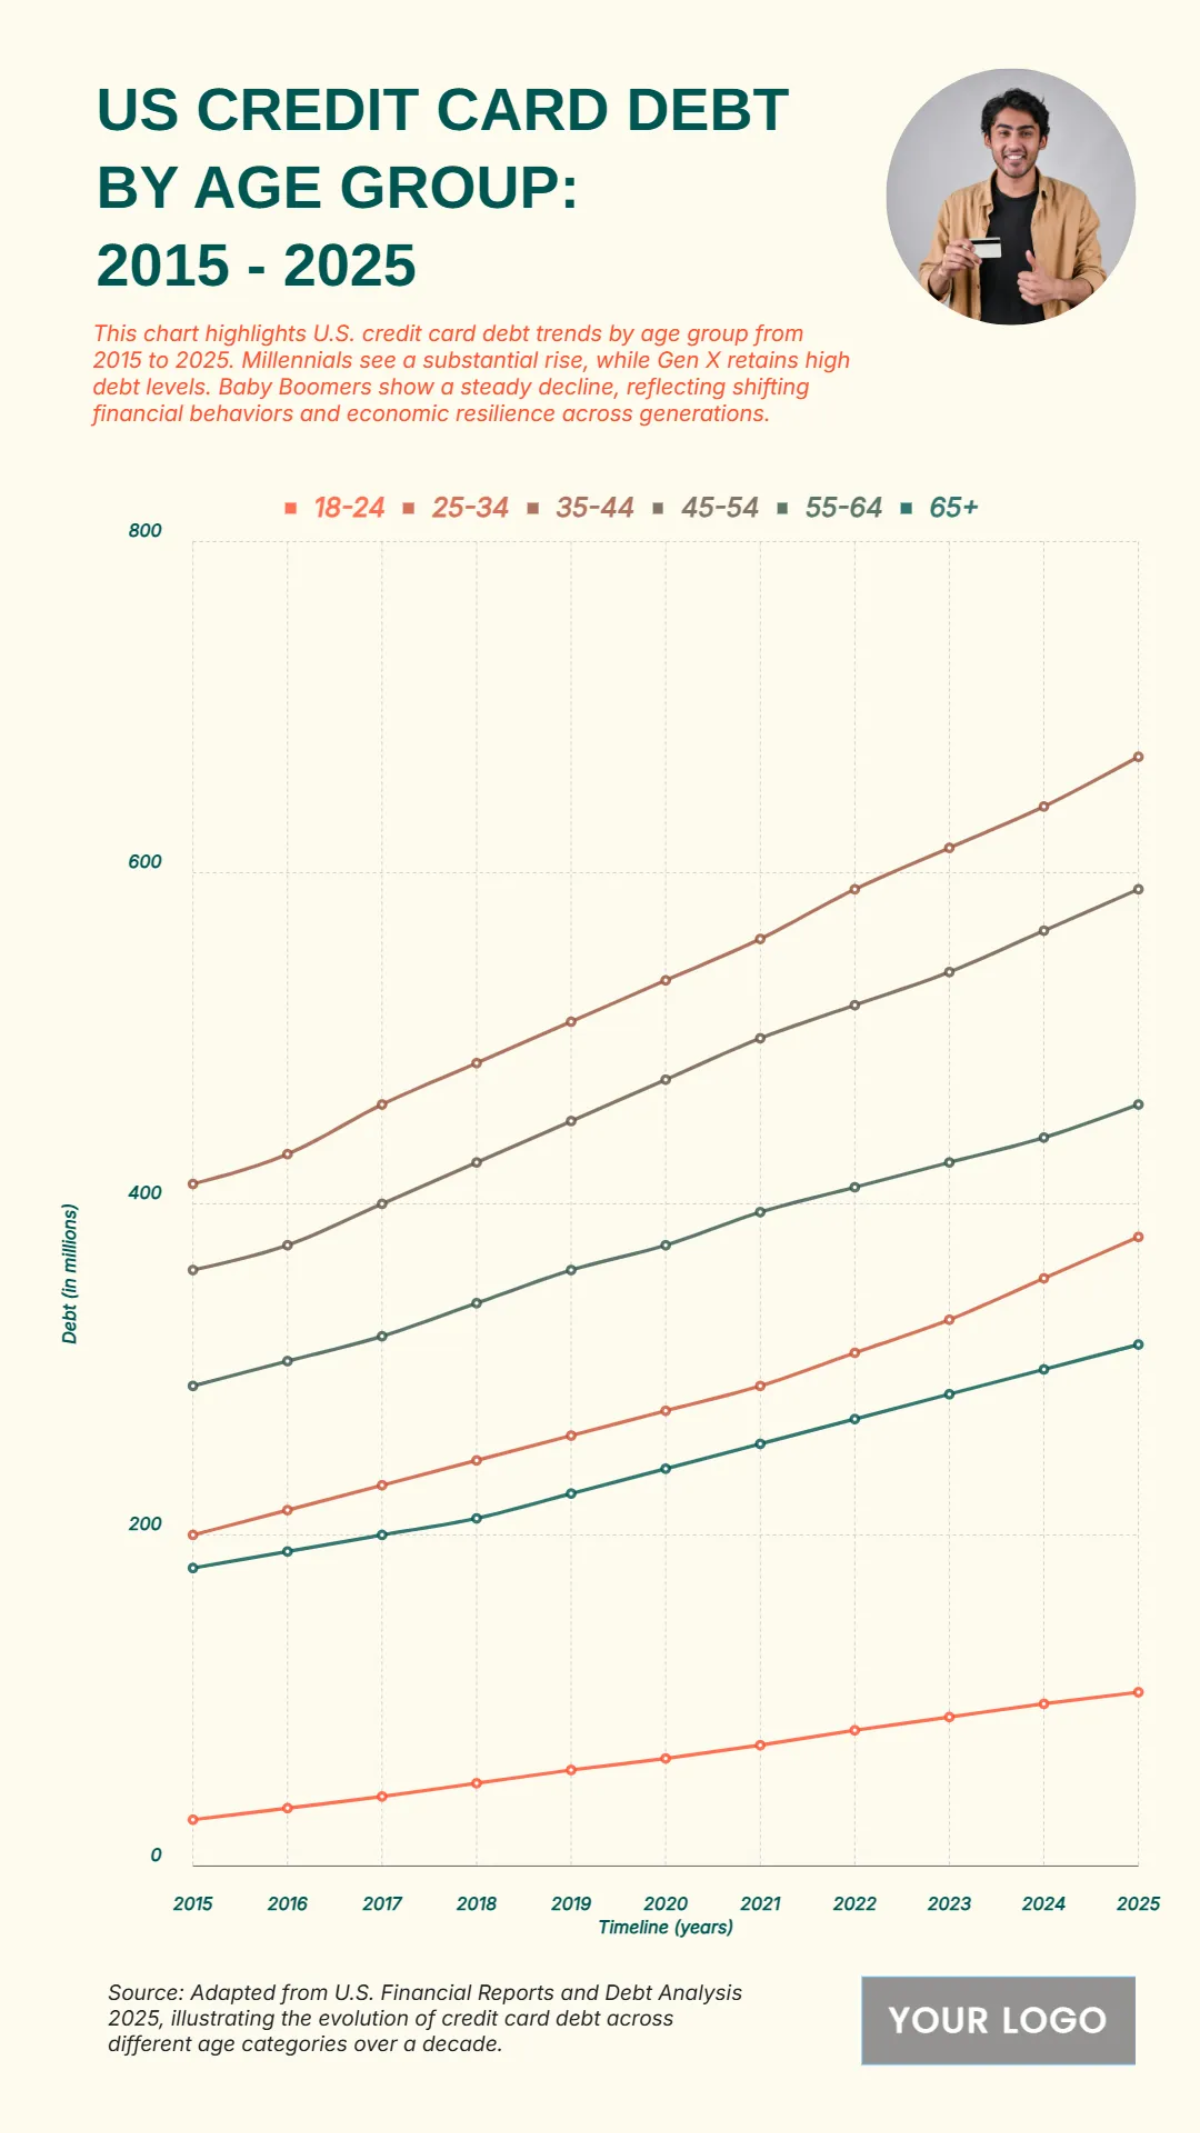
The chart “US Credit Card Debt by Age Group (2015–2025)” shows rising debt levels across all age brackets. Adults aged 45–54 consistently hold the highest balances, climbing from around $650M in 2015 to nearly $1.2B by 2025. The 35–44 group follows, increasing from about $500M in 2015 to over $900M by 2025. Debt among those 55–64 grows steadily, moving from $400M to $750M over the period, while the 25–34 group rises from about $250M to $600M. Older adults aged 65+ see debt expand from $200M to nearly $500M, and the youngest group 18–24 records the lowest but sharpest relative increase, starting at under $100M in 2015 and reaching close to $250M by 2025.
This data highlights a broad upward trend in credit card debt across all ages, with middle-aged groups (35–54) carrying the largest burdens, while younger and older Americans experience faster percentage growth, reflecting shifting borrowing patterns and financial pressures across generations.


