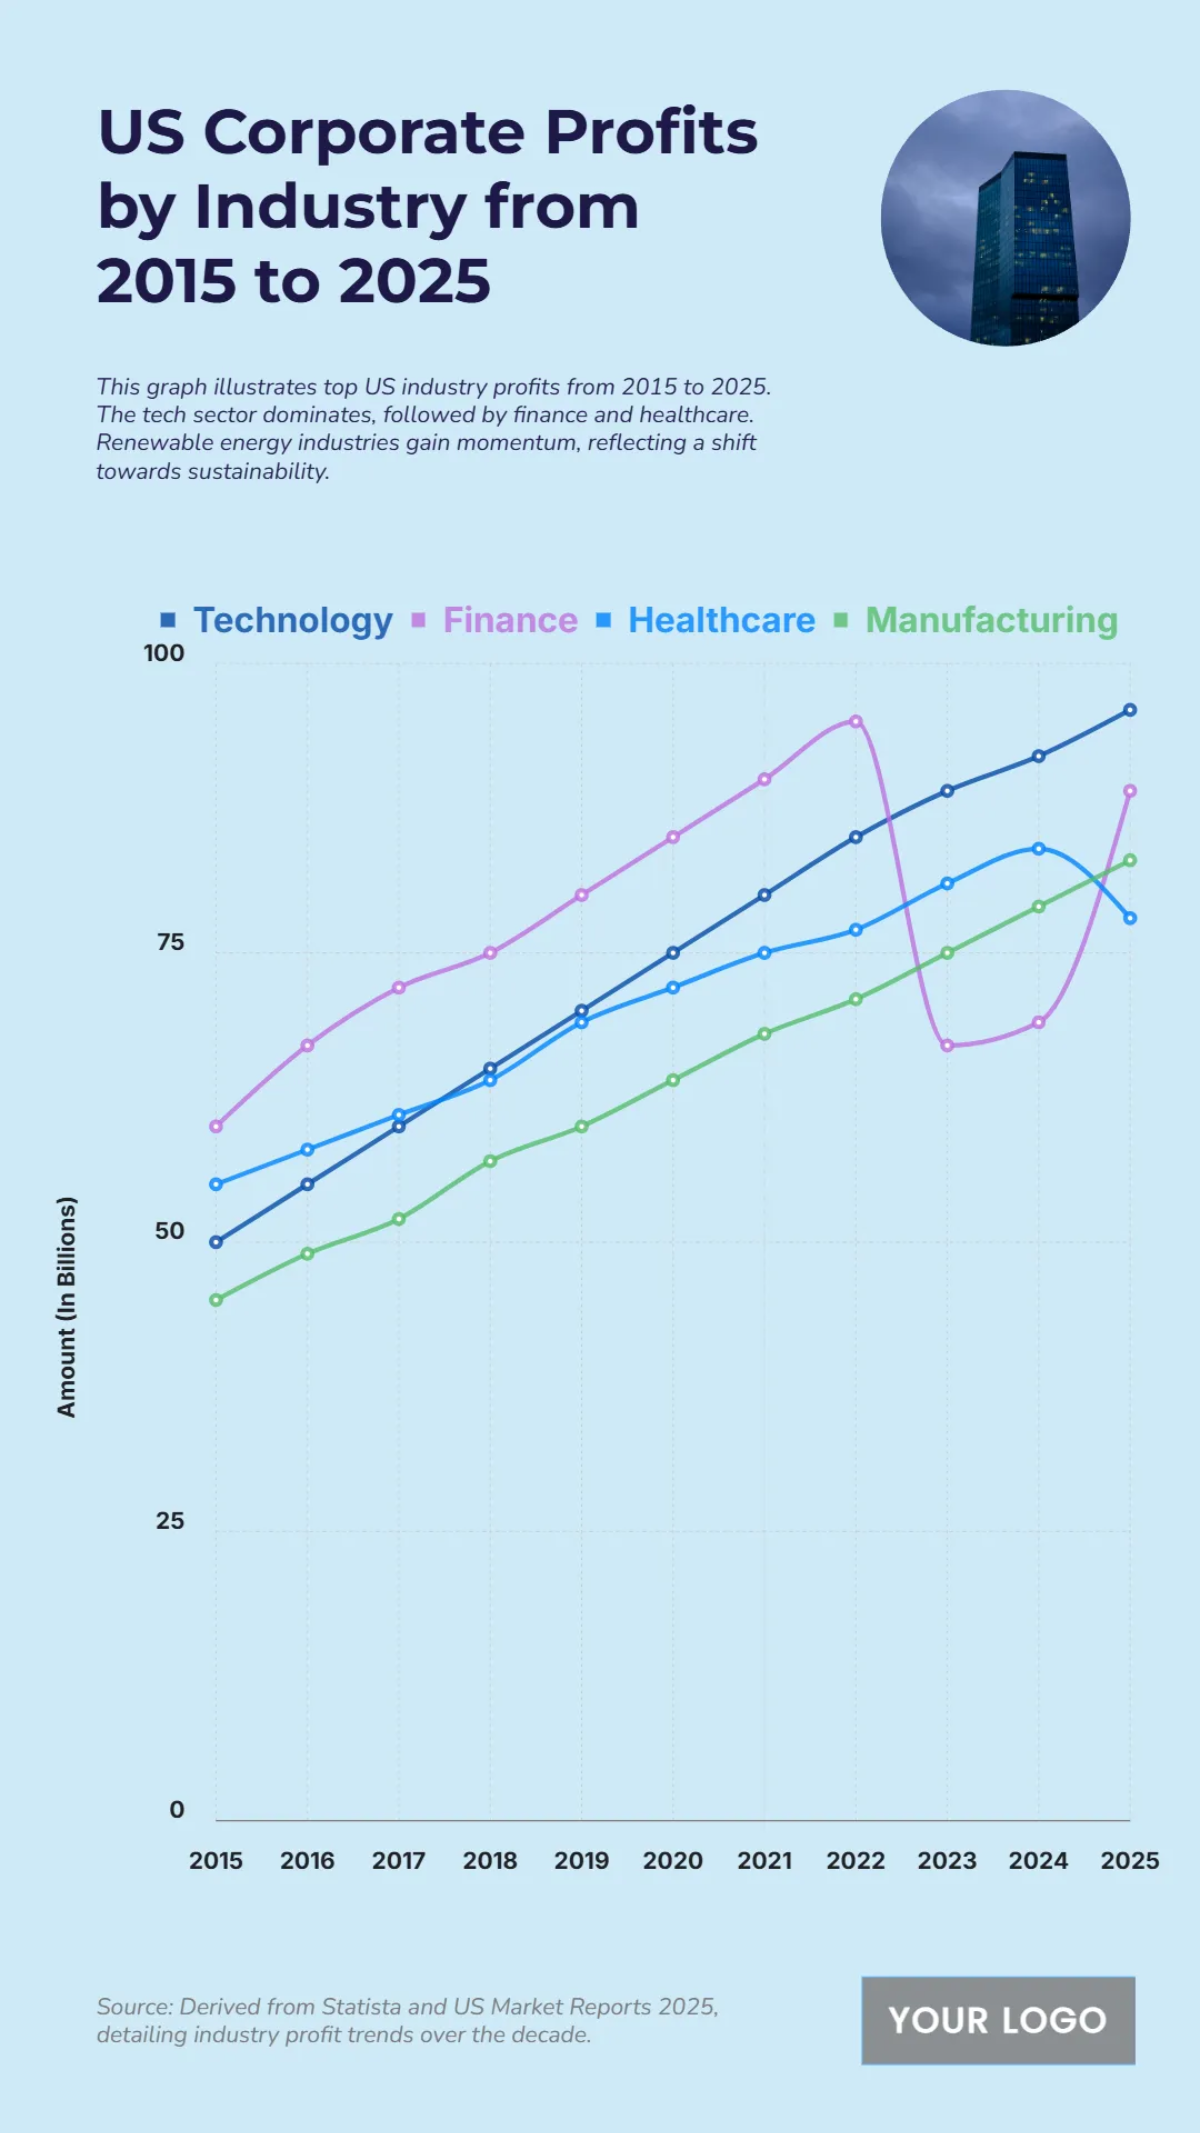
Free US Corporate Profits by Industry from 2015 to 2025
The chart shows trends in U.S. corporate profits across industries from 2015 to 2025. Technology and healthcare lead the strongest growth, while finance and manufacturing remain steady contributors. Energy and retail display more fluctuations, reflecting shifts in demand and global conditions. By 2025, profit gaps across industries become more pronounced.
| Labels | Technology | Finance | Healthcare | Manufacturing |
|---|---|---|---|---|
| 2015 | 50 | 60 | 55 | 45 |
| 2016 | 55 | 67 | 58 | 49 |
| 2017 | 60 | 72 | 61 | 52 |
| 2018 | 65 | 75 | 64 | 57 |
| 2019 | 70 | 80 | 69 | 60 |
| 2020 | 75 | 85 | 72 | 64 |
| 2021 | 80 | 90 | 75 | 68 |
| 2022 | 85 | 95 | 77 | 71 |
| 2023 | 89 | 67 | 81 | 75 |
| 2024 | 92 | 69 | 84 | 79 |
| 2025 | 96 | 89 | 78 | 83 |


