Free US Real Estate Investment by Region from 2015 to 2025
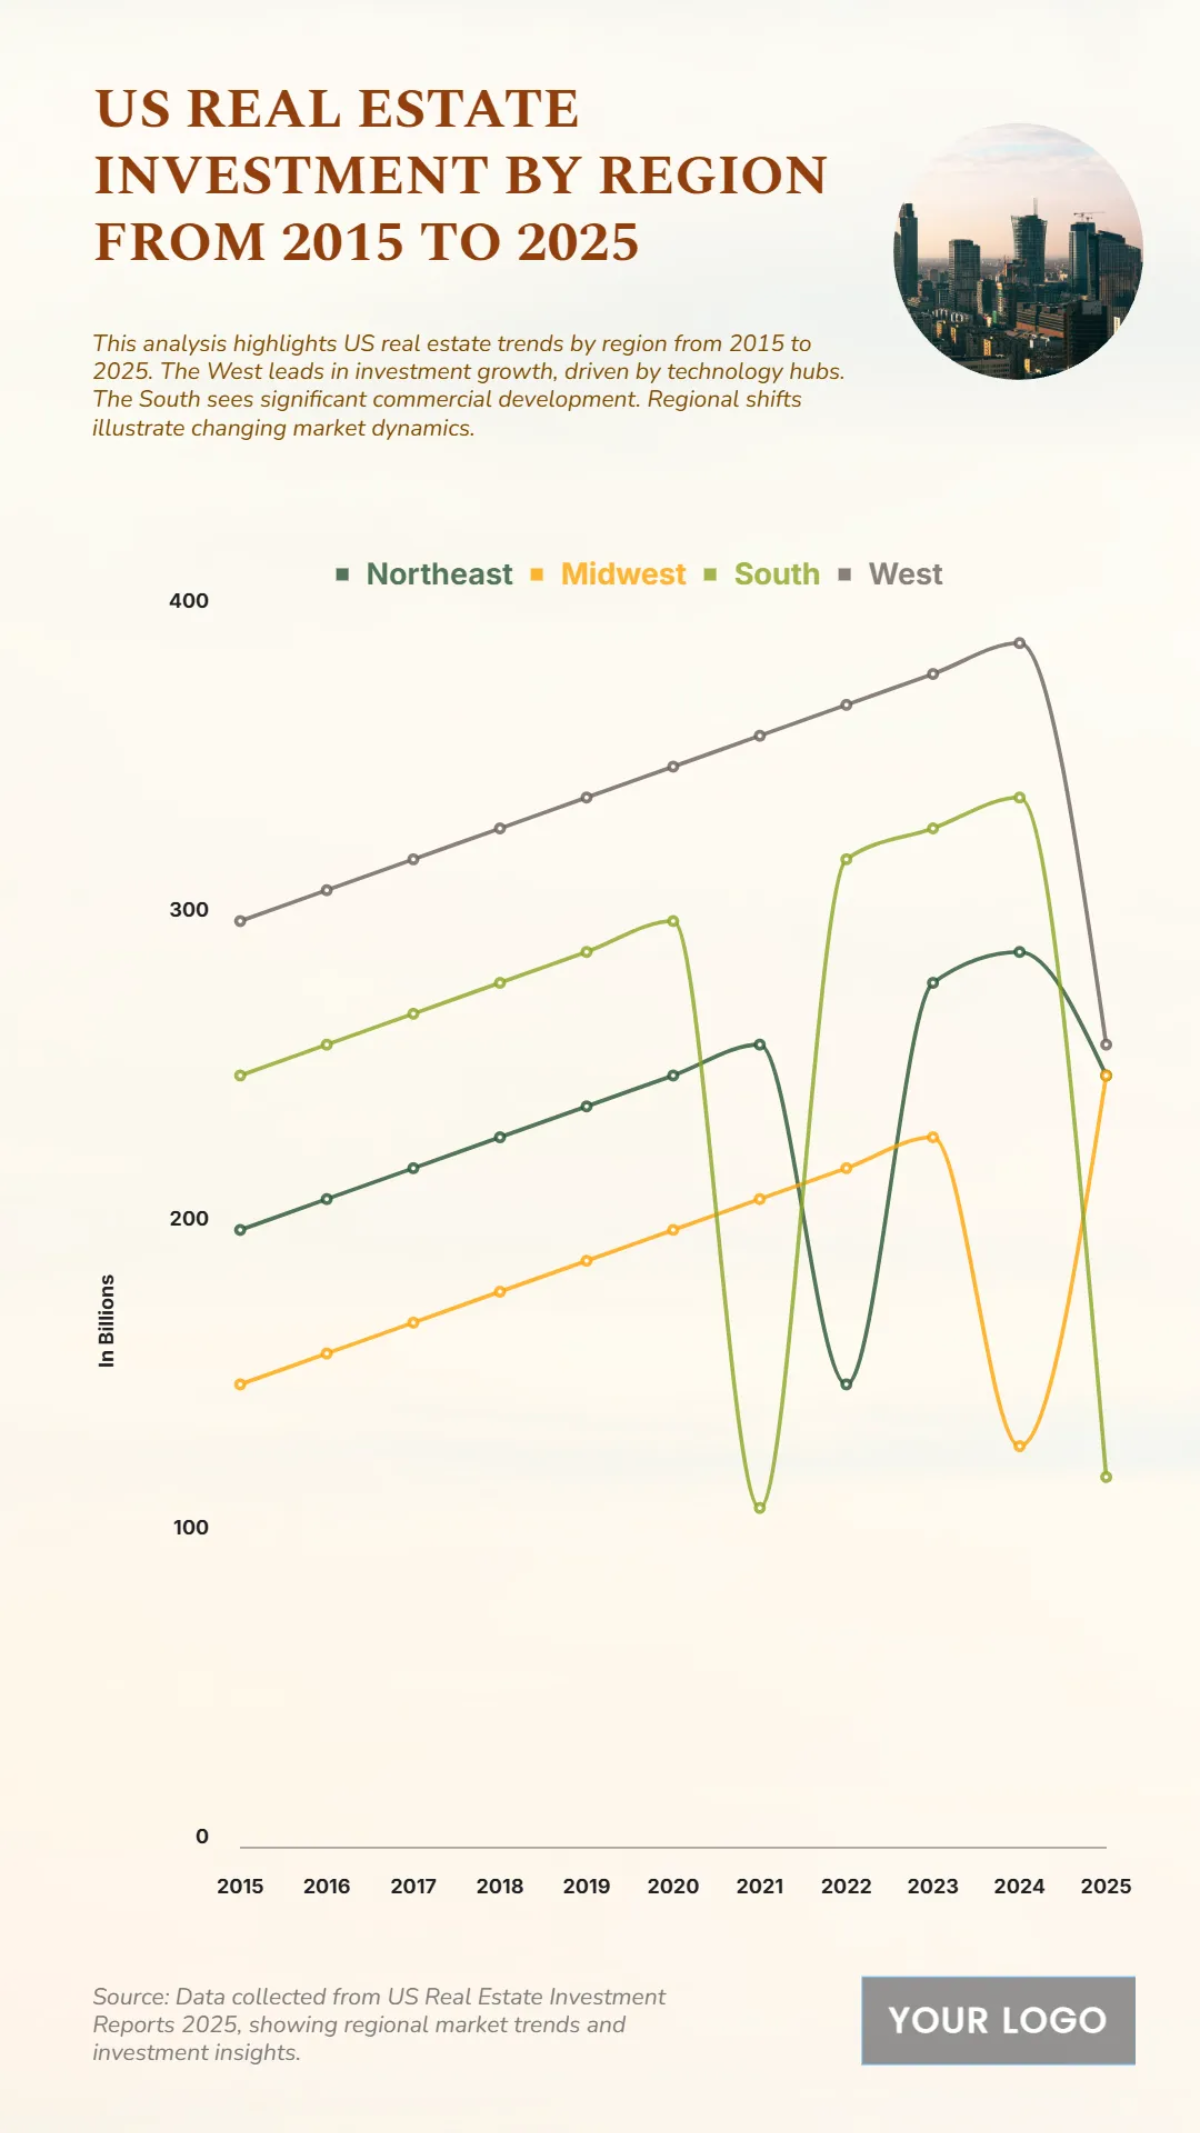
The chart illustrates real estate investment trends across U.S. regions from 2015 to 2025. The South and West emerge as the leading hubs, driven by population growth and urban expansion. The Northeast shows steadier but slower gains, while the Midwest reflects moderate increases tied to affordable housing and industrial projects. By 2025, regional differences in investment become more evident, highlighting the South and West as the dominant drivers of real estate growth.
| Labels | Northeast | Midwest | South | West |
|---|---|---|---|---|
| 2015 | 200 | 150 | 250 | 300 |
| 2016 | 210 | 160 | 260 | 310 |
| 2017 | 220 | 170 | 270 | 320 |
| 2018 | 230 | 180 | 280 | 330 |
| 2019 | 240 | 190 | 290 | 340 |
| 2020 | 250 | 200 | 300 | 350 |
| 2021 | 260 | 210 | 110 | 360 |
| 2022 | 150 | 220 | 320 | 370 |
| 2023 | 280 | 230 | 330 | 380 |
| 2024 | 290 | 130 | 340 | 390 |
| 2025 | 250 | 250 | 120 | 260 |


