Free US Public Debt per Capita by State from 2020 to 2025
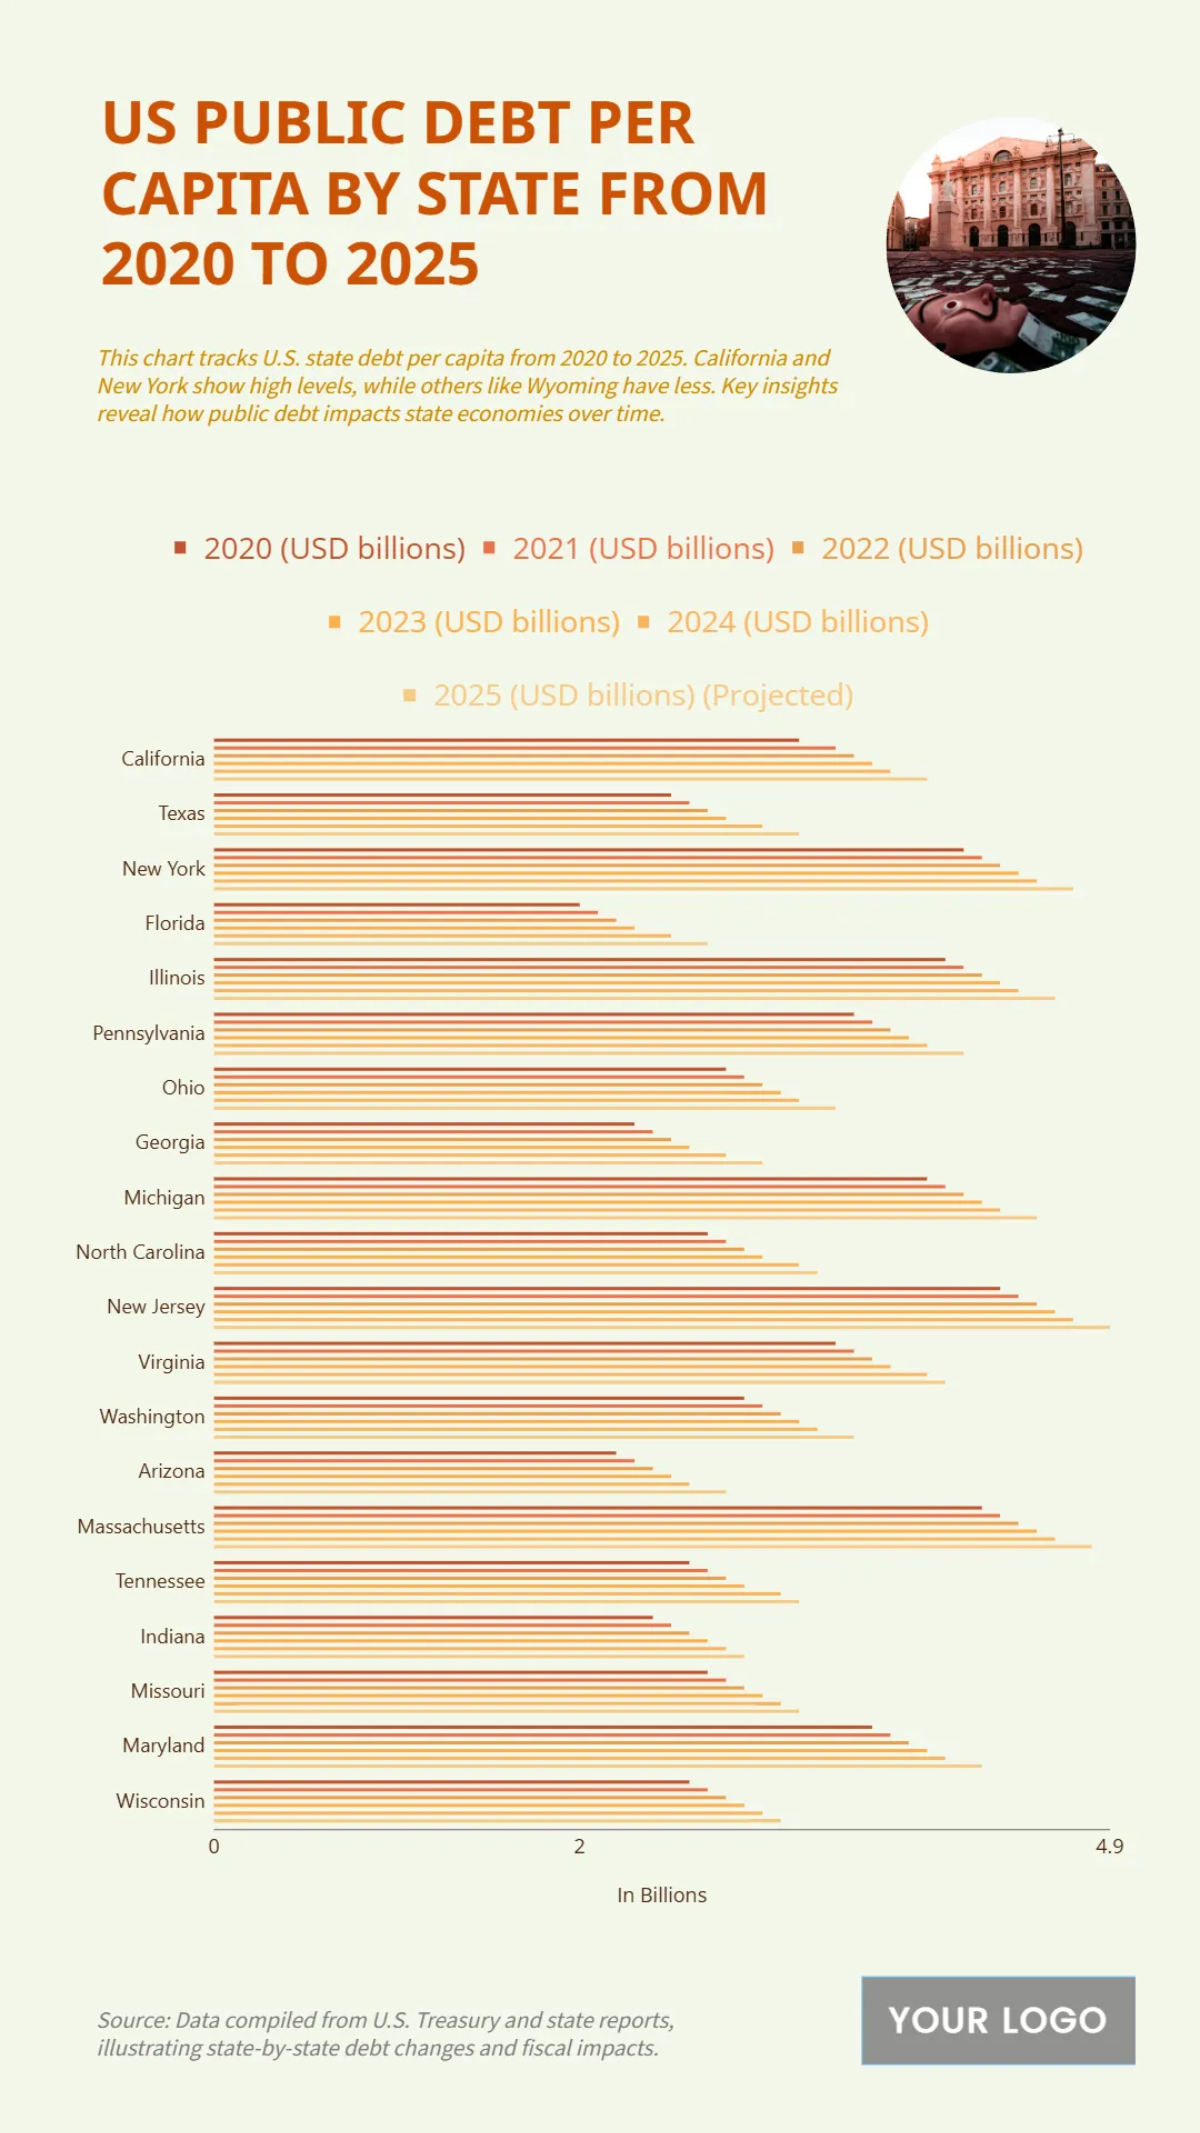
The chart highlights how public debt per capita has shifted across U.S. states between 2020 and 2025. States with higher spending and slower revenue growth show sharper increases, while fiscally conservative states experience steadier trends. By 2025, a clear divide emerges, with some states carrying significantly higher per-person debt burdens compared to others, underscoring the varying fiscal pressures across the country.
| Labels | 2020 (USD billions) | 2021 (USD billions) | 2022 (USD billions) | 2023 (USD billions) | 2024 (USD billions) | 2025 (USD billions) (Projected) |
|---|---|---|---|---|---|---|
| California | 3.2 | 3.4 | 3.5 | 3.6 | 3.7 | 3.9 |
| Texas | 2.5 | 2.6 | 2.7 | 2.8 | 3.0 | 3.2 |
| New York | 4.1 | 4.2 | 4.3 | 4.4 | 4.5 | 4.7 |
| Florida | 2.0 | 2.1 | 2.2 | 2.3 | 2.5 | 2.7 |
| Illinois | 4.0 | 4.1 | 4.2 | 4.3 | 4.4 | 4.6 |
| Pennsylvania | 3.5 | 3.6 | 3.7 | 3.8 | 3.9 | 4.1 |
| Ohio | 2.8 | 2.9 | 3.0 | 3.1 | 3.2 | 3.4 |
| Georgia | 2.3 | 2.4 | 2.5 | 2.6 | 2.8 | 3.0 |
| Michigan | 3.9 | 4.0 | 4.1 | 4.2 | 4.3 | 4.5 |
| North Carolina | 2.7 | 2.8 | 2.9 | 3.0 | 3.1 | 3.3 |
| New Jersey | 4.3 | 4.4 | 4.5 | 4.6 | 4.7 | 4.9 |
| Virginia | 3.4 | 3.5 | 3.6 | 3.7 | 3.9 | 4.0 |
| Washington | 2.9 | 3.0 | 3.1 | 3.2 | 3.3 | 3.5 |
| Arizona | 2.2 | 2.3 | 2.4 | 2.5 | 2.6 | 2.8 |
| Massachusetts | 4.2 | 4.3 | 4.4 | 4.5 | 4.6 | 4.8 |
| Tennessee | 2.6 | 2.7 | 2.8 | 2.9 | 3.0 | 3.2 |
| Indiana | 2.4 | 2.5 | 2.6 | 2.7 | 2.8 | 2.9 |
| Missouri | 2.7 | 2.8 | 2.9 | 3.0 | 3.1 | 3.3 |
| Maryland | 3.6 | 3.7 | 3.8 | 3.9 | 4.0 | 4.2 |
| Wisconsin | 2.6 | 2.7 | 2.8 | 2.9 | 3.0 | 3.1 |


