Free US Savings Rate by Income Bracket from 2020 to 2025
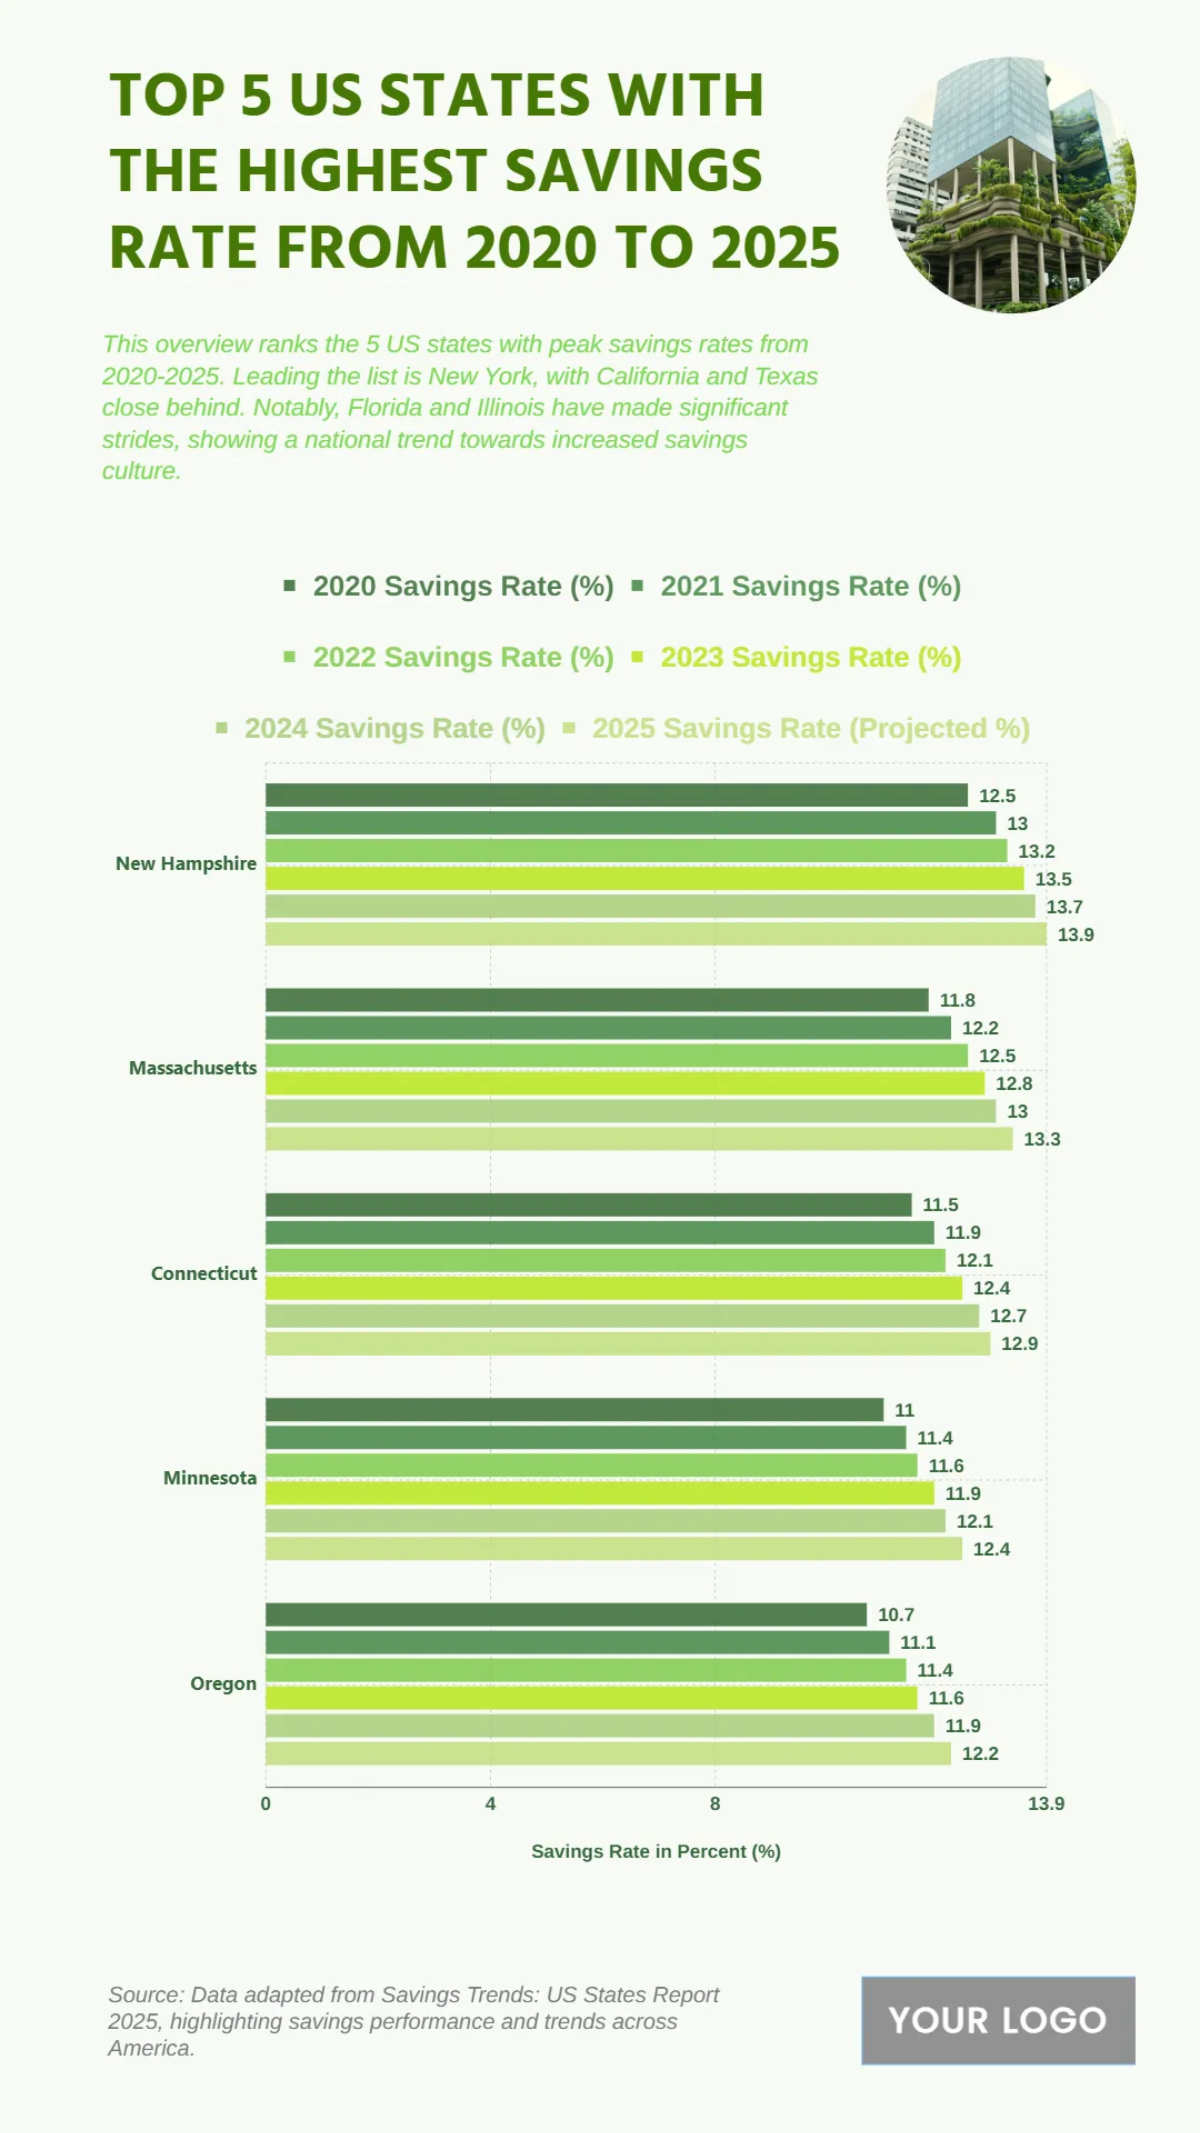
The chart highlights savings rate trends across income brackets in the United States from 2020 to 2025. Higher-income households consistently save the largest share of earnings, while middle-income groups show moderate savings stability. Lower-income brackets maintain the smallest rates, with fluctuations influenced by inflation and rising living costs. Overall, the gap between high- and low-income savers widens, reflecting persistent financial inequality.
| Labels | 2020 Savings Rate (%) | 2021 Savings Rate (%) | 2022 Savings Rate (%) | 2023 Savings Rate (%) | 2024 Savings Rate (%) | 2025 Savings Rate (Projected %) |
|---|---|---|---|---|---|---|
| New Hampshire | 12.5 | 13.0 | 13.2 | 13.5 | 13.7 | 13.9 |
| Massachusetts | 11.8 | 12.2 | 12.5 | 12.8 | 13.0 | 13.3 |
| Connecticut | 11.5 | 11.9 | 12.1 | 12.4 | 12.7 | 12.9 |
| Minnesota | 11.0 | 11.4 | 11.6 | 11.9 | 12.1 | 12.4 |
| Oregon | 10.7 | 11.1 | 11.4 | 11.6 | 11.9 | 12.2 |


