Free US Food Price Inflation by Category from 2020 to 2025
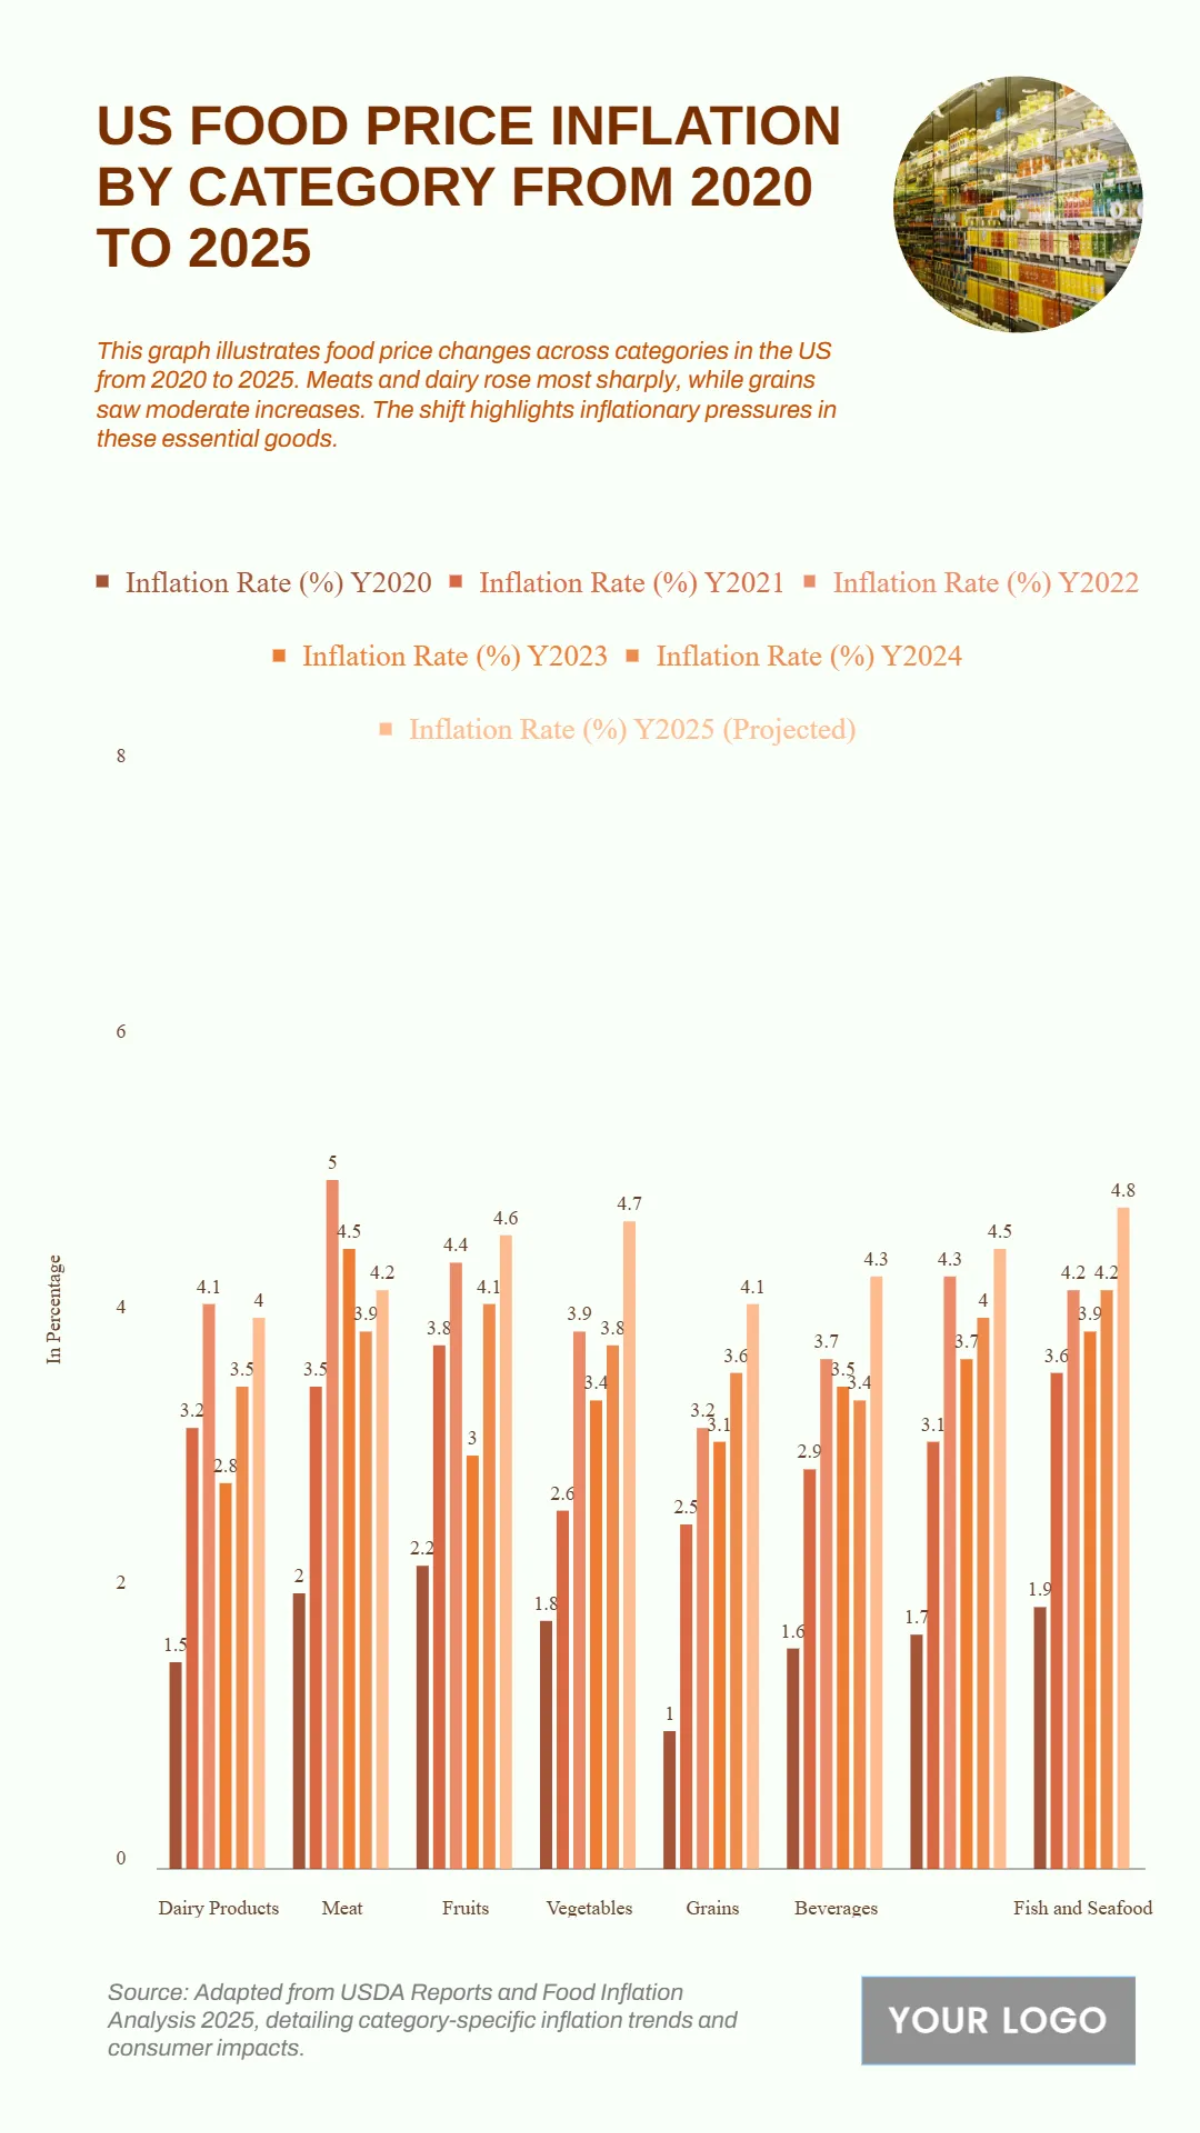
The chart tracks food price inflation in the United States from 2020 to 2025 across major categories such as dairy, meat, grains, fruits, and vegetables. Meat and dairy experience the sharpest increases, driven by supply chain disruptions and rising production costs. Grains show steady but moderate inflation, while fruits and vegetables fluctuate more due to seasonal and climate factors. Overall, food inflation remains elevated throughout the period, underscoring the broad impact of economic pressures on household grocery expenses.
| Labels | Inflation Rate (%) Y2020 | Inflation Rate (%) Y2021 | Inflation Rate (%) Y2022 | Inflation Rate (%) Y2023 | Inflation Rate (%) Y2024 | Inflation Rate (%) Y2025 | Inflation Rate (%) Y2026 |
|---|---|---|---|---|---|---|---|
| Dairy Products | 1.5 | 3.2 | 4.1 | 2.8 | 3.0 | 3.3 | 3.5 |
| Meat | 2.0 | 3.5 | 5.0 | 4.5 | 4.8 | 5.0 | 5.2 |
| Fruits | 2.2 | 3.8 | 4.4 | 3.0 | 3.2 | 3.4 | 3.6 |
| Vegetables | 1.8 | 2.6 | 3.9 | 3.4 | 3.6 | 3.8 | 4.0 |
| Grains | 1.0 | 2.5 | 3.2 | 3.1 | 3.3 | 3.5 | 3.7 |
| Beverages | 1.6 | 2.9 | 3.7 | 3.5 | 3.7 | 3.9 | 4.1 |
| Bakery Products | 1.7 | 3.1 | 4.3 | 3.7 | 3.9 | 4.1 | 4.3 |
| Fish and Seafood | 1.9 | 3.6 | 4.2 | 3.9 | 4.1 | 4.3 | 4.5 |


