Free US Energy Sector Revenue by Source from 2015 to 2025
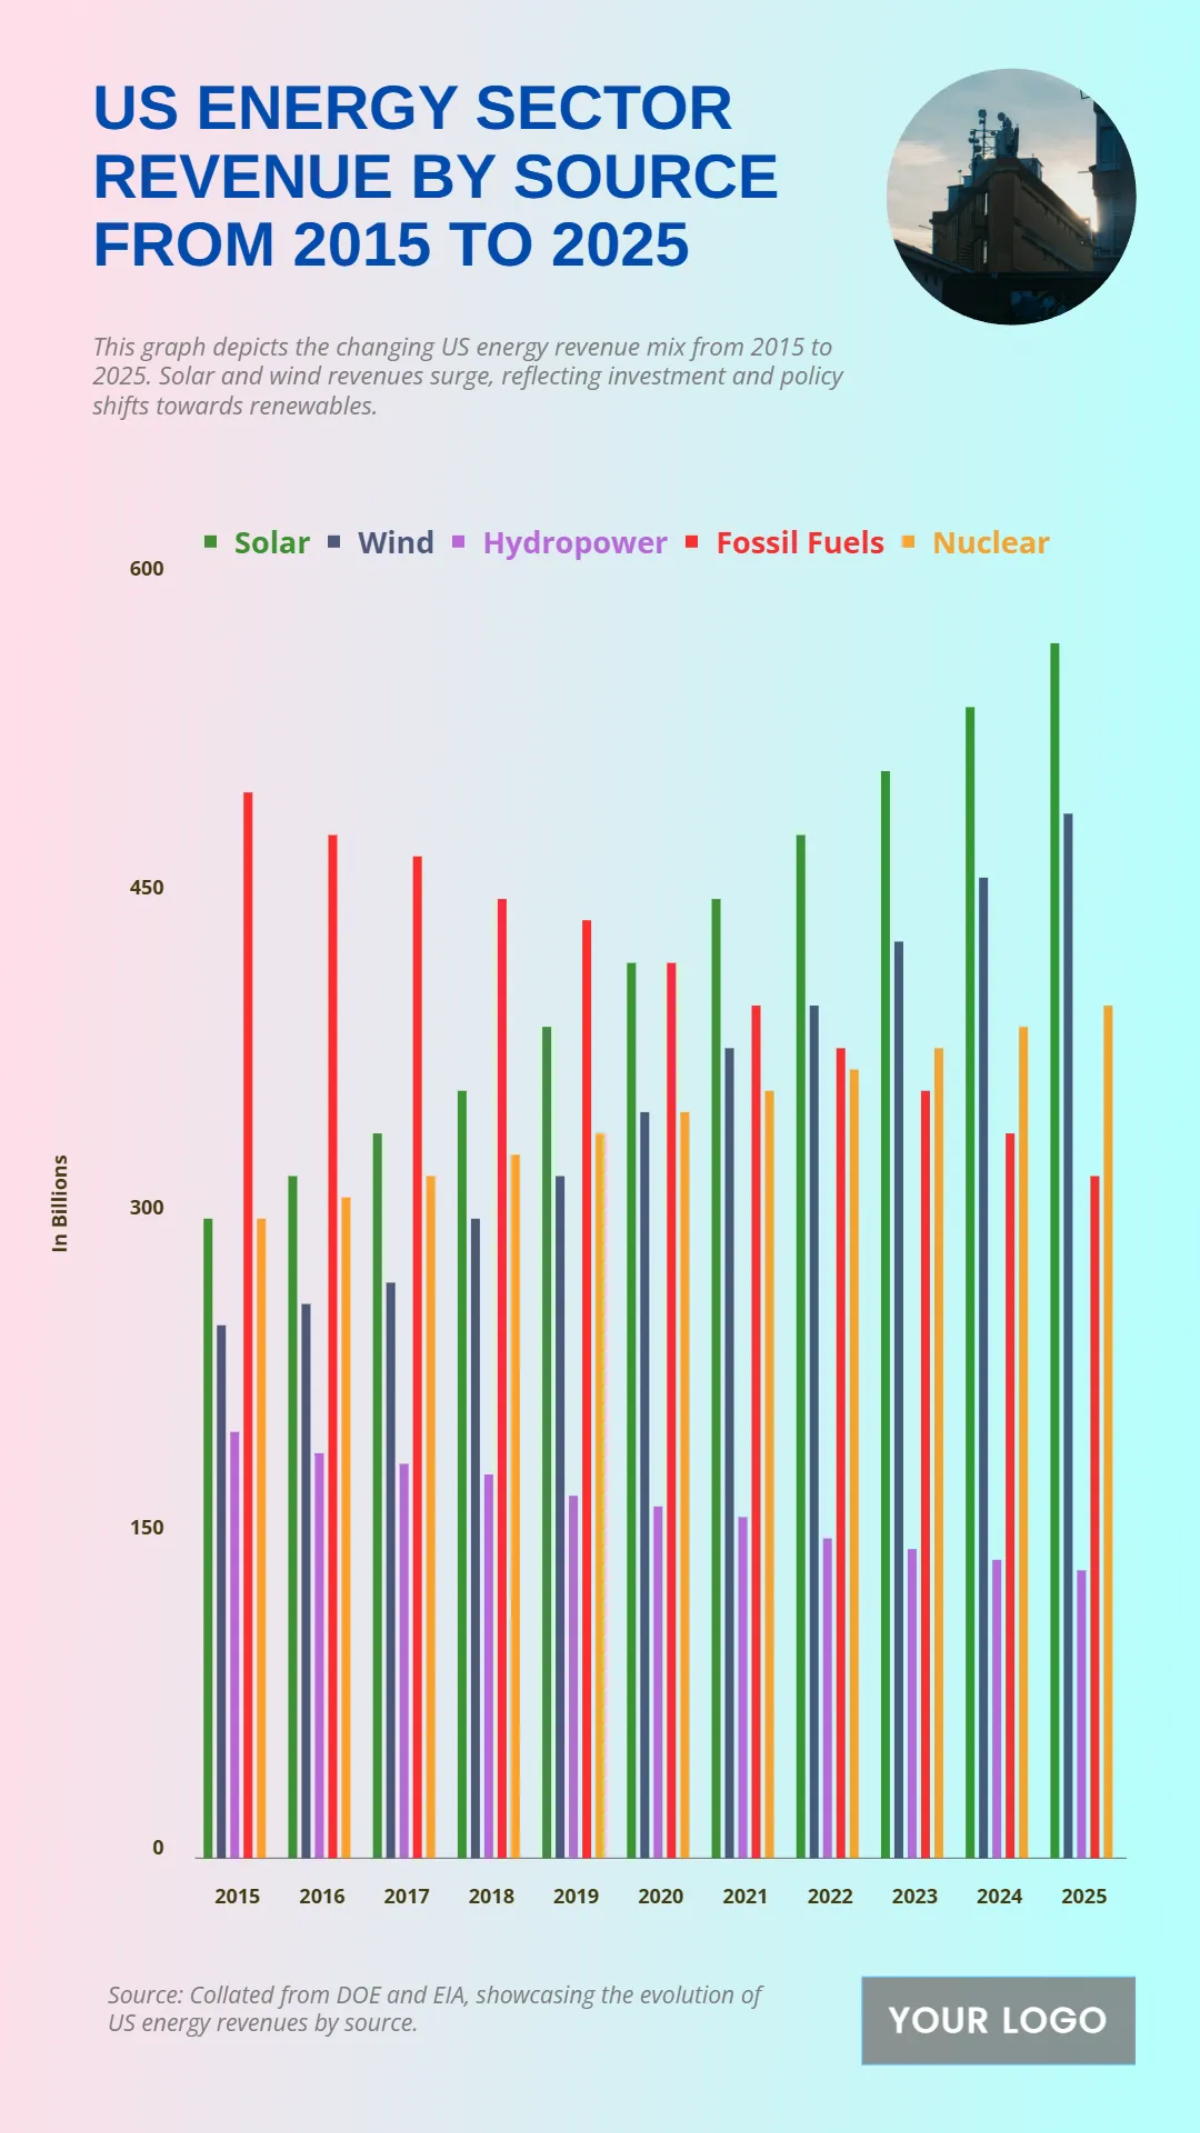
The chart illustrates revenue trends in the US energy sector from 2015 to 2025, segmented by sources such as oil, natural gas, coal, nuclear, and renewables. Oil and natural gas remain dominant, but their revenues fluctuate with global price shifts and demand cycles. Coal revenue steadily declines over the period, reflecting reduced reliance on fossil fuels. Nuclear energy shows modest stability, while renewables—including wind and solar—exhibit the fastest growth, nearly doubling their share by 2025. The data highlights the sector’s transition toward cleaner energy sources while maintaining strong reliance on oil and gas for revenue generation.
| Labels | Solar | Wind | Hydropower | Fossil Fuels | Nuclear |
|---|---|---|---|---|---|
| 2015 | 300 | 250 | 200 | 500 | 300 |
| 2016 | 320 | 260 | 190 | 480 | 310 |
| 2017 | 340 | 270 | 185 | 470 | 320 |
| 2018 | 360 | 300 | 180 | 450 | 330 |
| 2019 | 390 | 320 | 170 | 440 | 340 |
| 2020 | 420 | 350 | 165 | 420 | 350 |
| 2021 | 450 | 380 | 160 | 400 | 360 |
| 2022 | 480 | 400 | 150 | 380 | 370 |
| 2023 | 510 | 430 | 145 | 360 | 380 |
| 2024 | 540 | 460 | 140 | 340 | 390 |
| 2025 | 570 | 490 | 135 | 320 | 400 |


