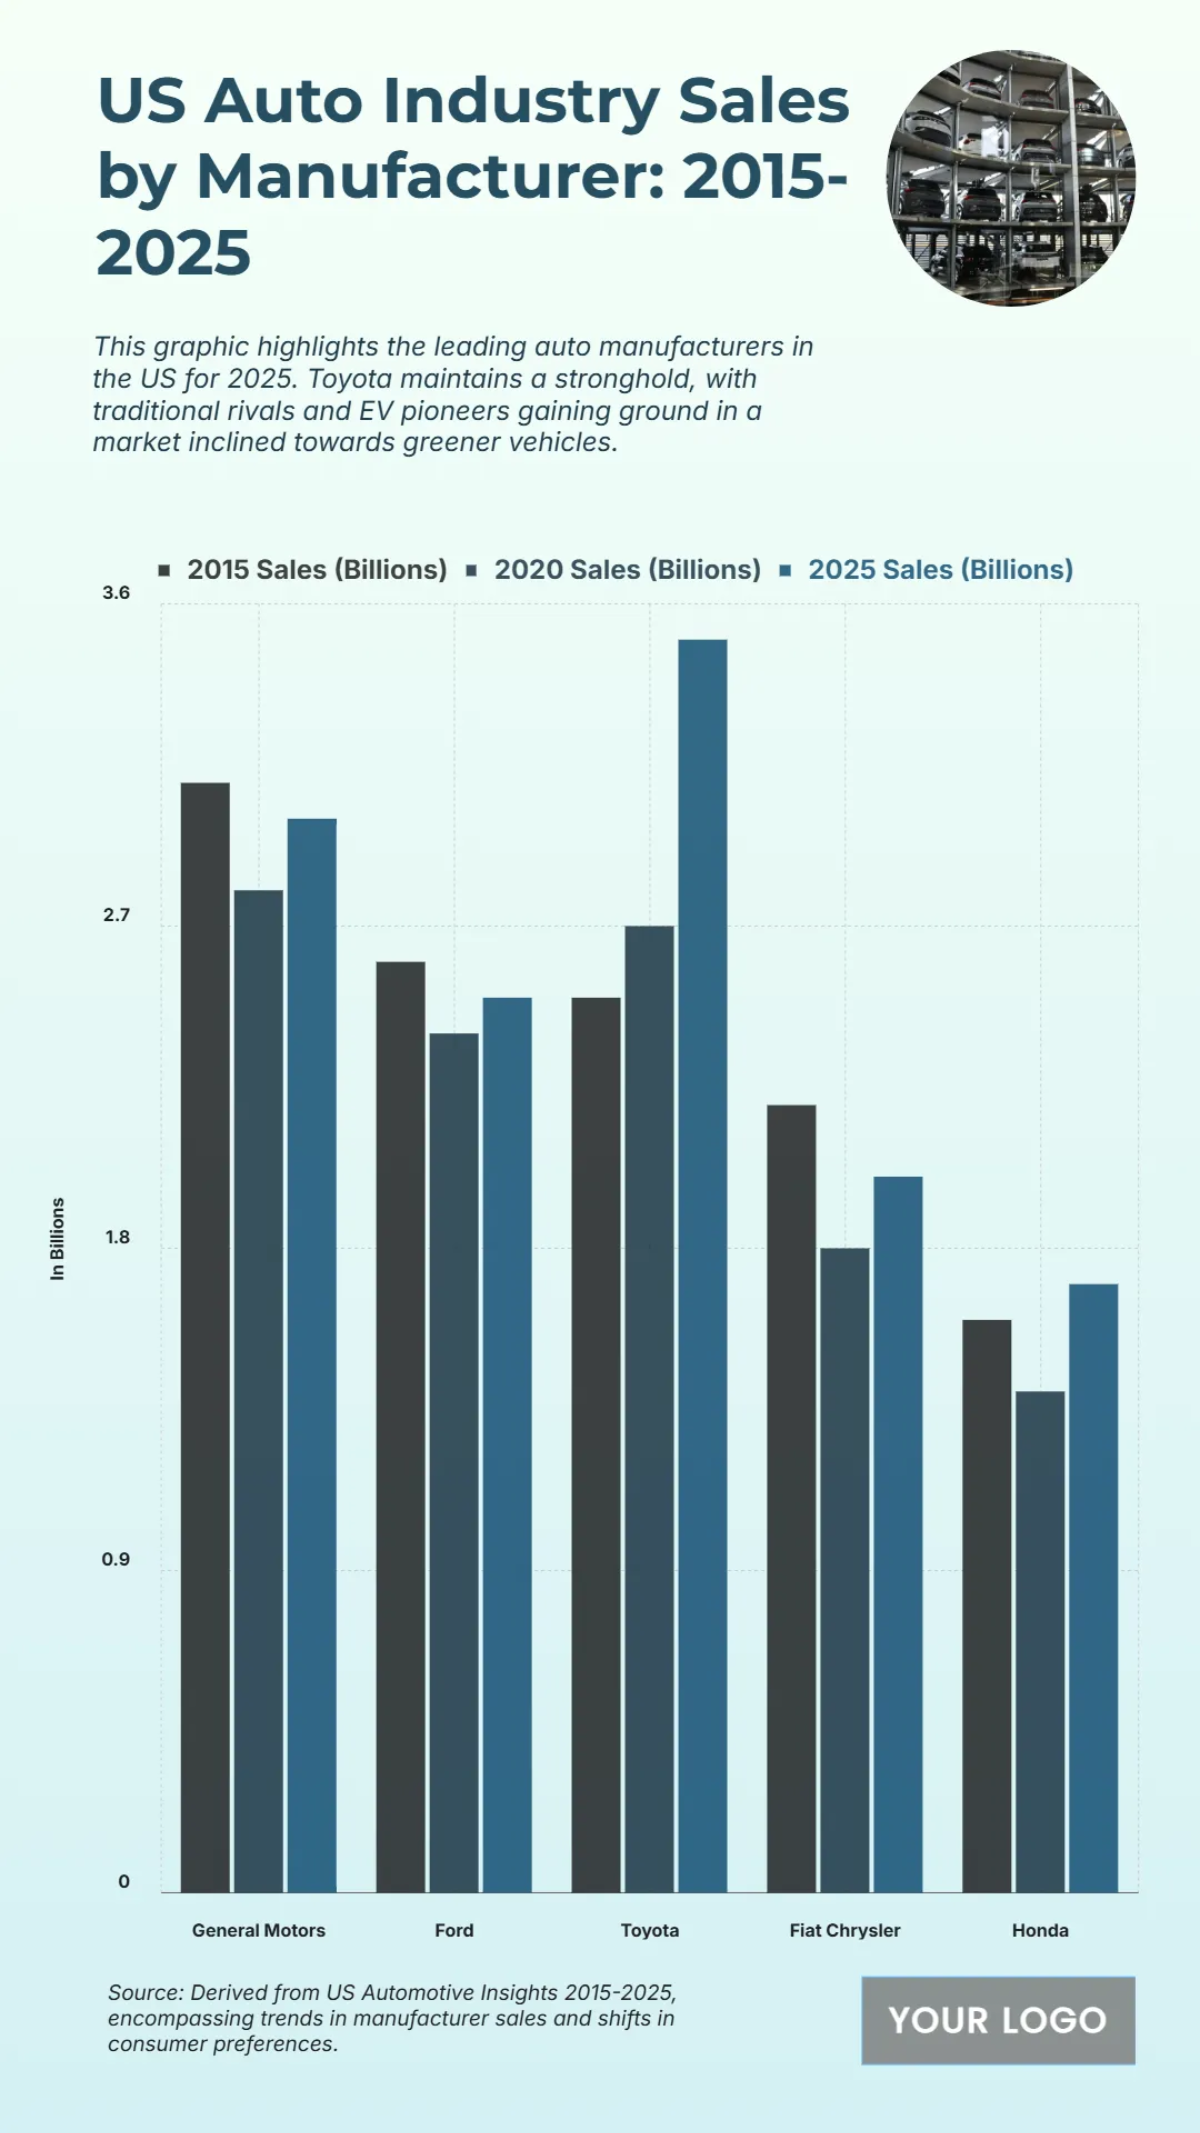
Free US Auto Industry Sales by Manufacturer from 2015 to 2025 Chart
The graphic provides an overview of US auto industry sales by manufacturer from 2015 to 2025, highlighting diverse performance trends among leading companies. Toyota, which began the period behind both General Motors and Ford, emerges as the clear leader by 2025 with sales rising from $2.5 billion in 2015 to $3.5 billion in 2025. In contrast, General Motors, despite starting as the top seller with $3.1 billion in 2015 sales, experienced a decline to $2.8 billion by 2020 before recovering slightly to $3.0 billion in 2025. Similarly, Ford's sales decreased from $2.6 billion to $2.5 billion over the decade. Fiat Chrysler and Honda both saw declines between 2015 and 2020 but showed modest recoveries by 2025, with their sales reaching $2.0 billion and $1.7 billion, respectively. The chart demonstrates a significant shift in market dominance, with Toyota gaining a stronghold while its traditional rivals faced sales challenges.


