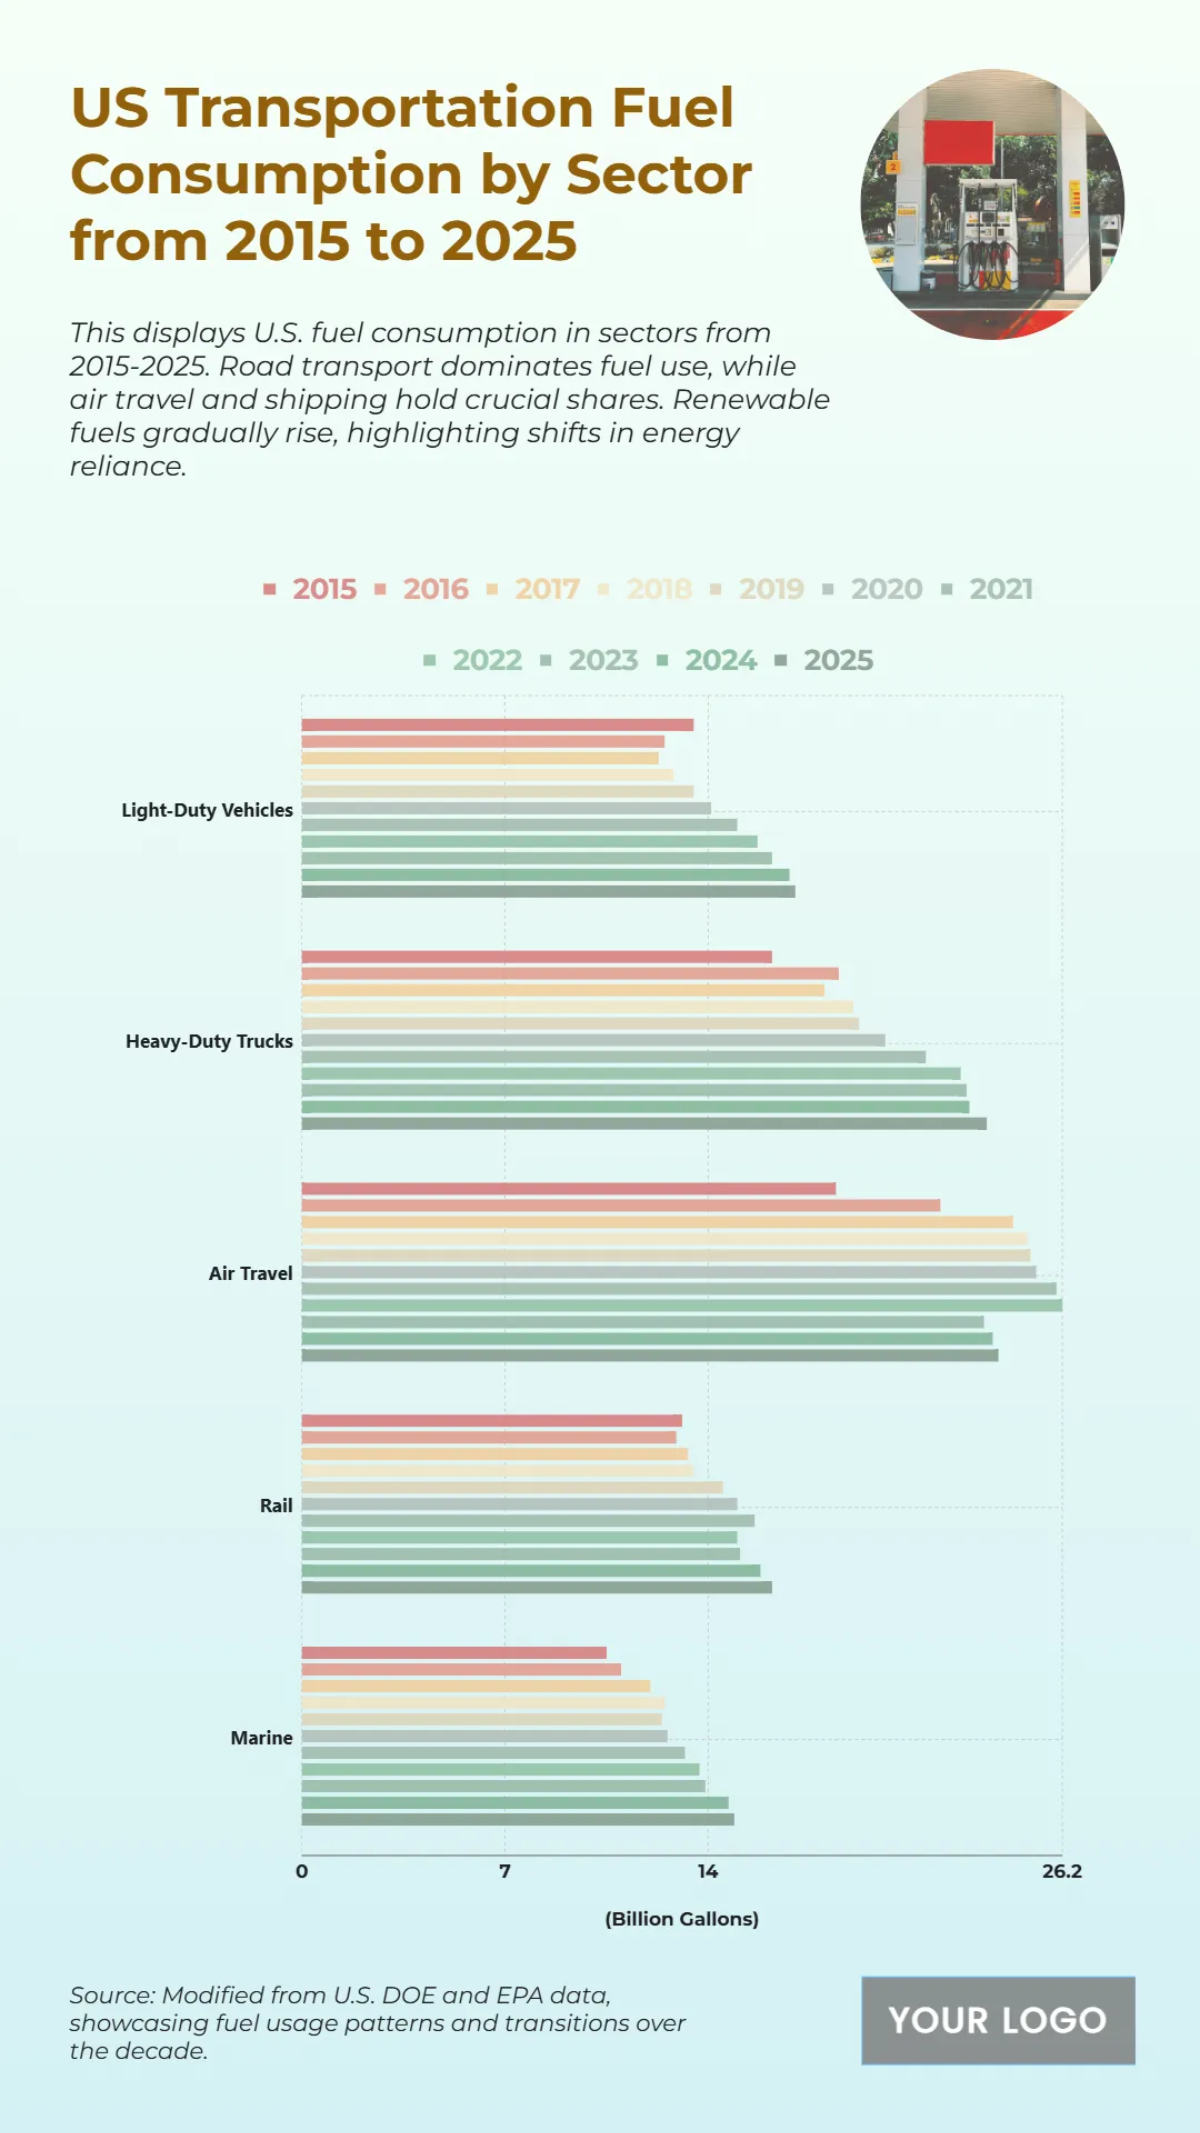
Free US Transportation Fuel Consumption by Sector from 2015 to 2025 Chart
The chart provides an overview of US transportation fuel consumption by sector from 2015 to 2025, revealing a strong dominance by road transport. Light-duty vehicles consistently had the highest consumption, starting at around 24 billion gallons in 2015 and rising to roughly 25 billion gallons by 2025. Heavy-duty trucks followed as the second-largest consumer, with their usage growing from approximately 18 billion gallons to 20 billion gallons over the decade. This widespread consumption is driven by several key factors. The chart shows a notable impact of the pandemic around 2020, particularly on air travel, which saw a significant dip in consumption before a sharp recovery. The air travel sector's fuel use increased from around 14 billion gallons to 17 billion gallons over the period despite the interruption. The rail and marine sectors also show a general upward trend in consumption.


