Free US Retirement Savings by Age Group from 2015 to 2025
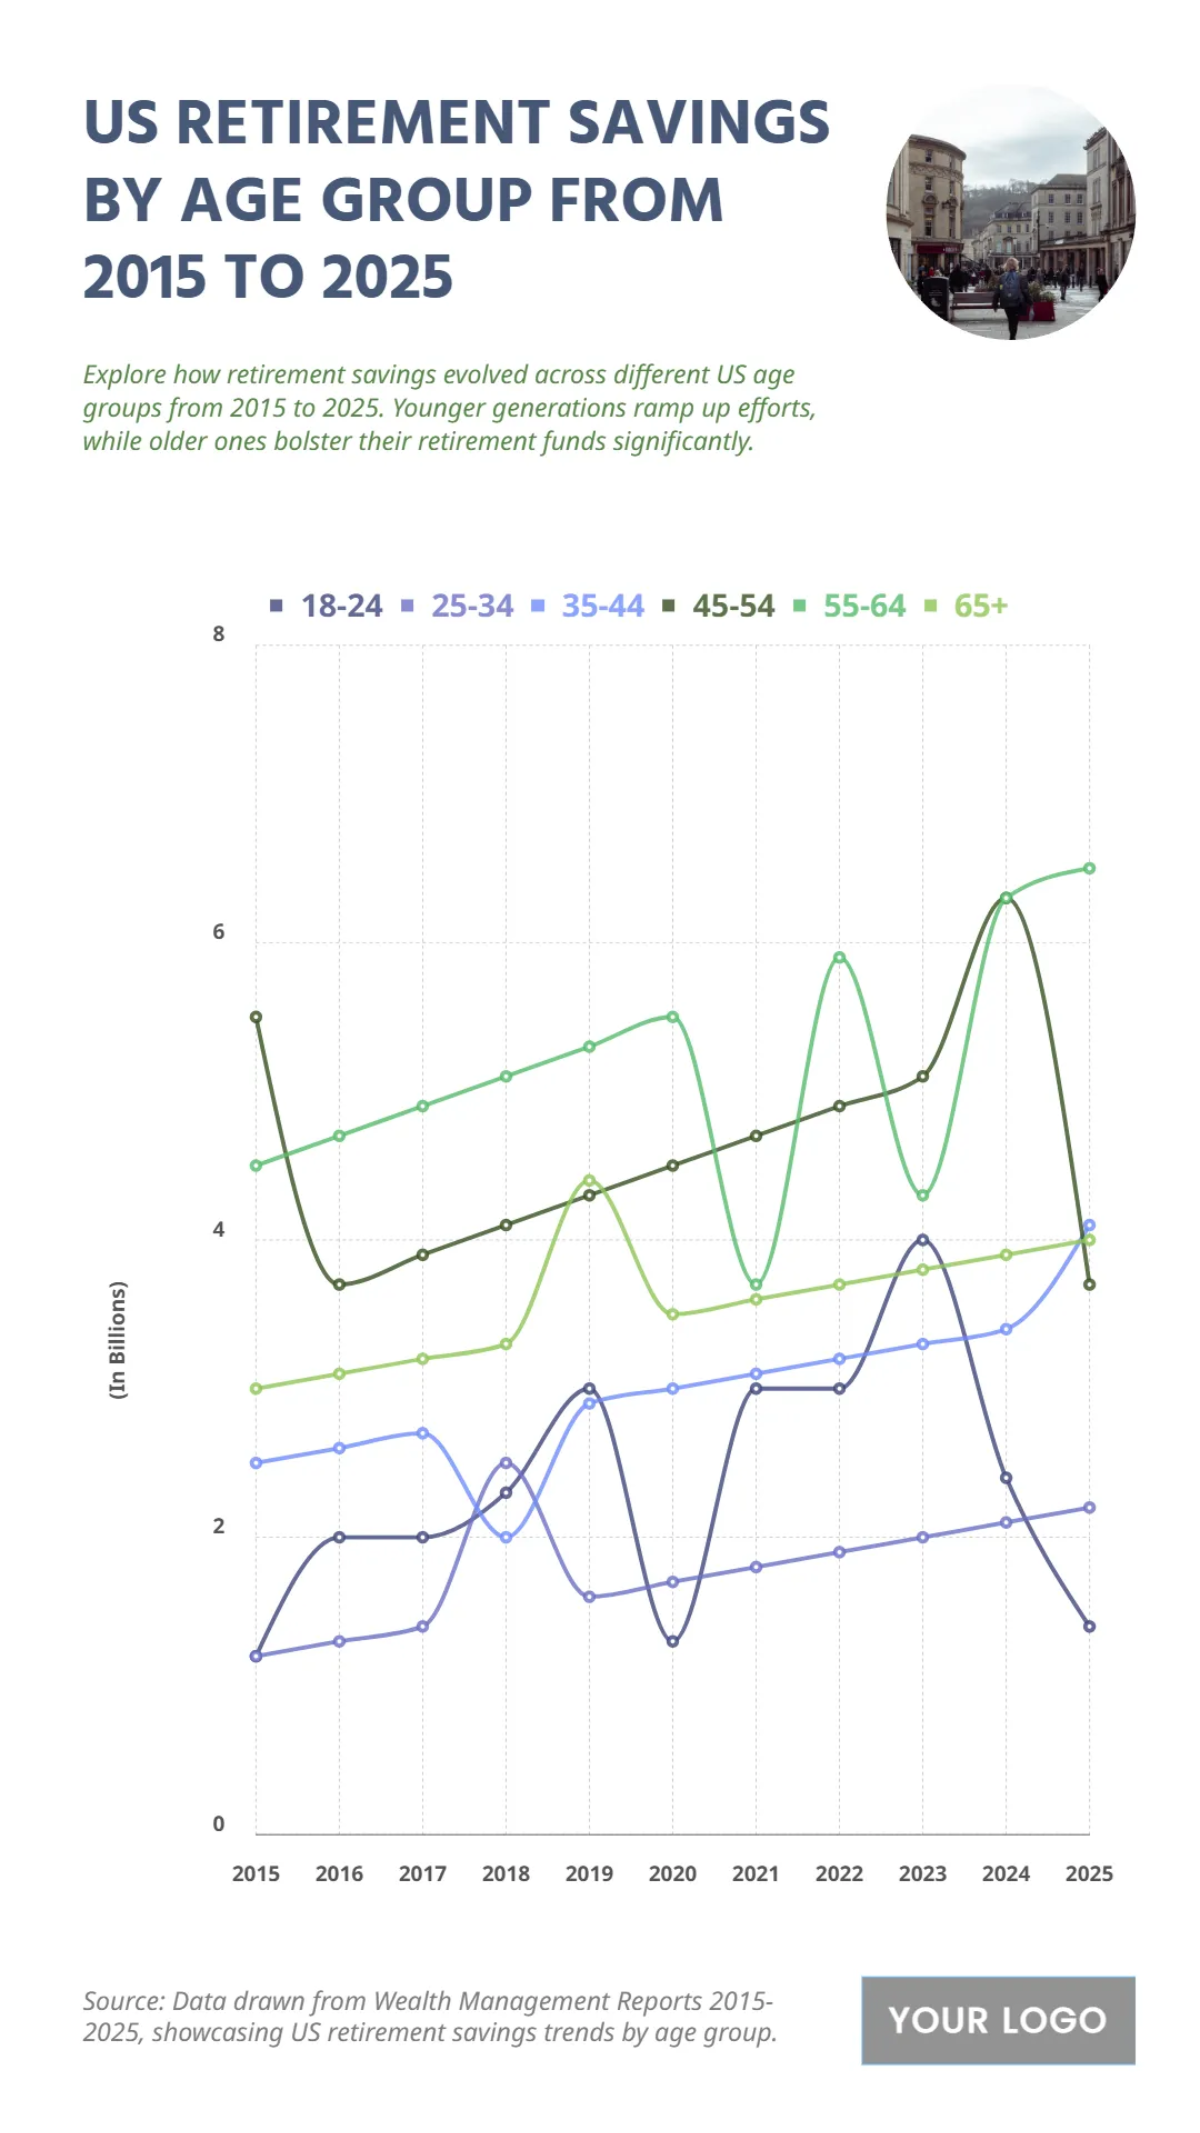
The chart provides an overview of US retirement savings by age group from 2015 to 2025, revealing a general upward trend for all generations, albeit with significant volatility, especially for older groups. The 55-64 age group consistently holds the highest savings, reaching a peak of around $6.5 billion in 2024. The 45-54 and 65+ groups follow, with the 65+ group showing a particularly sharp decline after a peak in 2024. The younger generations, while having lower total savings, show a more stable and consistent growth. The 25-34 age group, for example, increased their savings from roughly $2.5 billion to $4 billion over the decade.
| Labels | 18–24 | 25–34 | 35–44 | 45–54 | 55–64 | 65+ |
|---|---|---|---|---|---|---|
| 2015 | 1.2 | 1.2 | 2.5 | 5.5 | 4.5 | 3 |
| 2016 | 2 | 1.3 | 2.6 | 3.7 | 4.7 | 3.1 |
| 2017 | 2 | 1.4 | 2.7 | 3.9 | 4.9 | 3.2 |
| 2018 | 2.3 | 2.5 | 2 | 4.1 | 5.1 | 3.3 |
| 2019 | 3 | 1.6 | 2.9 | 4.3 | 5.3 | 4.4 |
| 2020 | 1.3 | 1.7 | 3 | 4.5 | 5.5 | 3.5 |
| 2021 | 3 | 1.8 | 3.1 | 4.7 | 3.7 | 3.6 |
| 2022 | 3 | 1.9 | 3.2 | 4.9 | 5.9 | 3.7 |
| 2023 | 4 | 2 | 3.3 | 5.1 | 4.3 | 3.8 |
| 2024 | 2.4 | 2.1 | 3.4 | 6.3 | 6.3 | 3.9 |
| 2025 | 1.4 | 2.2 | 4.1 | 3.7 | 6.5 | 4 |


