Free US Import Dependency by Product Category from 2015 to 2025

- 100% Customizable, free editor
- Access 1 Million+ Templates, photo’s & graphics
- Download or share as a template
- Click and replace photos, graphics, text, backgrounds
- Resize, crop, AI write & more
- Access advanced editor
AI AI Chart and Graph Generator
Generate my free AI Chart and Graph Text or voice to generate a free AI Chart and Graph
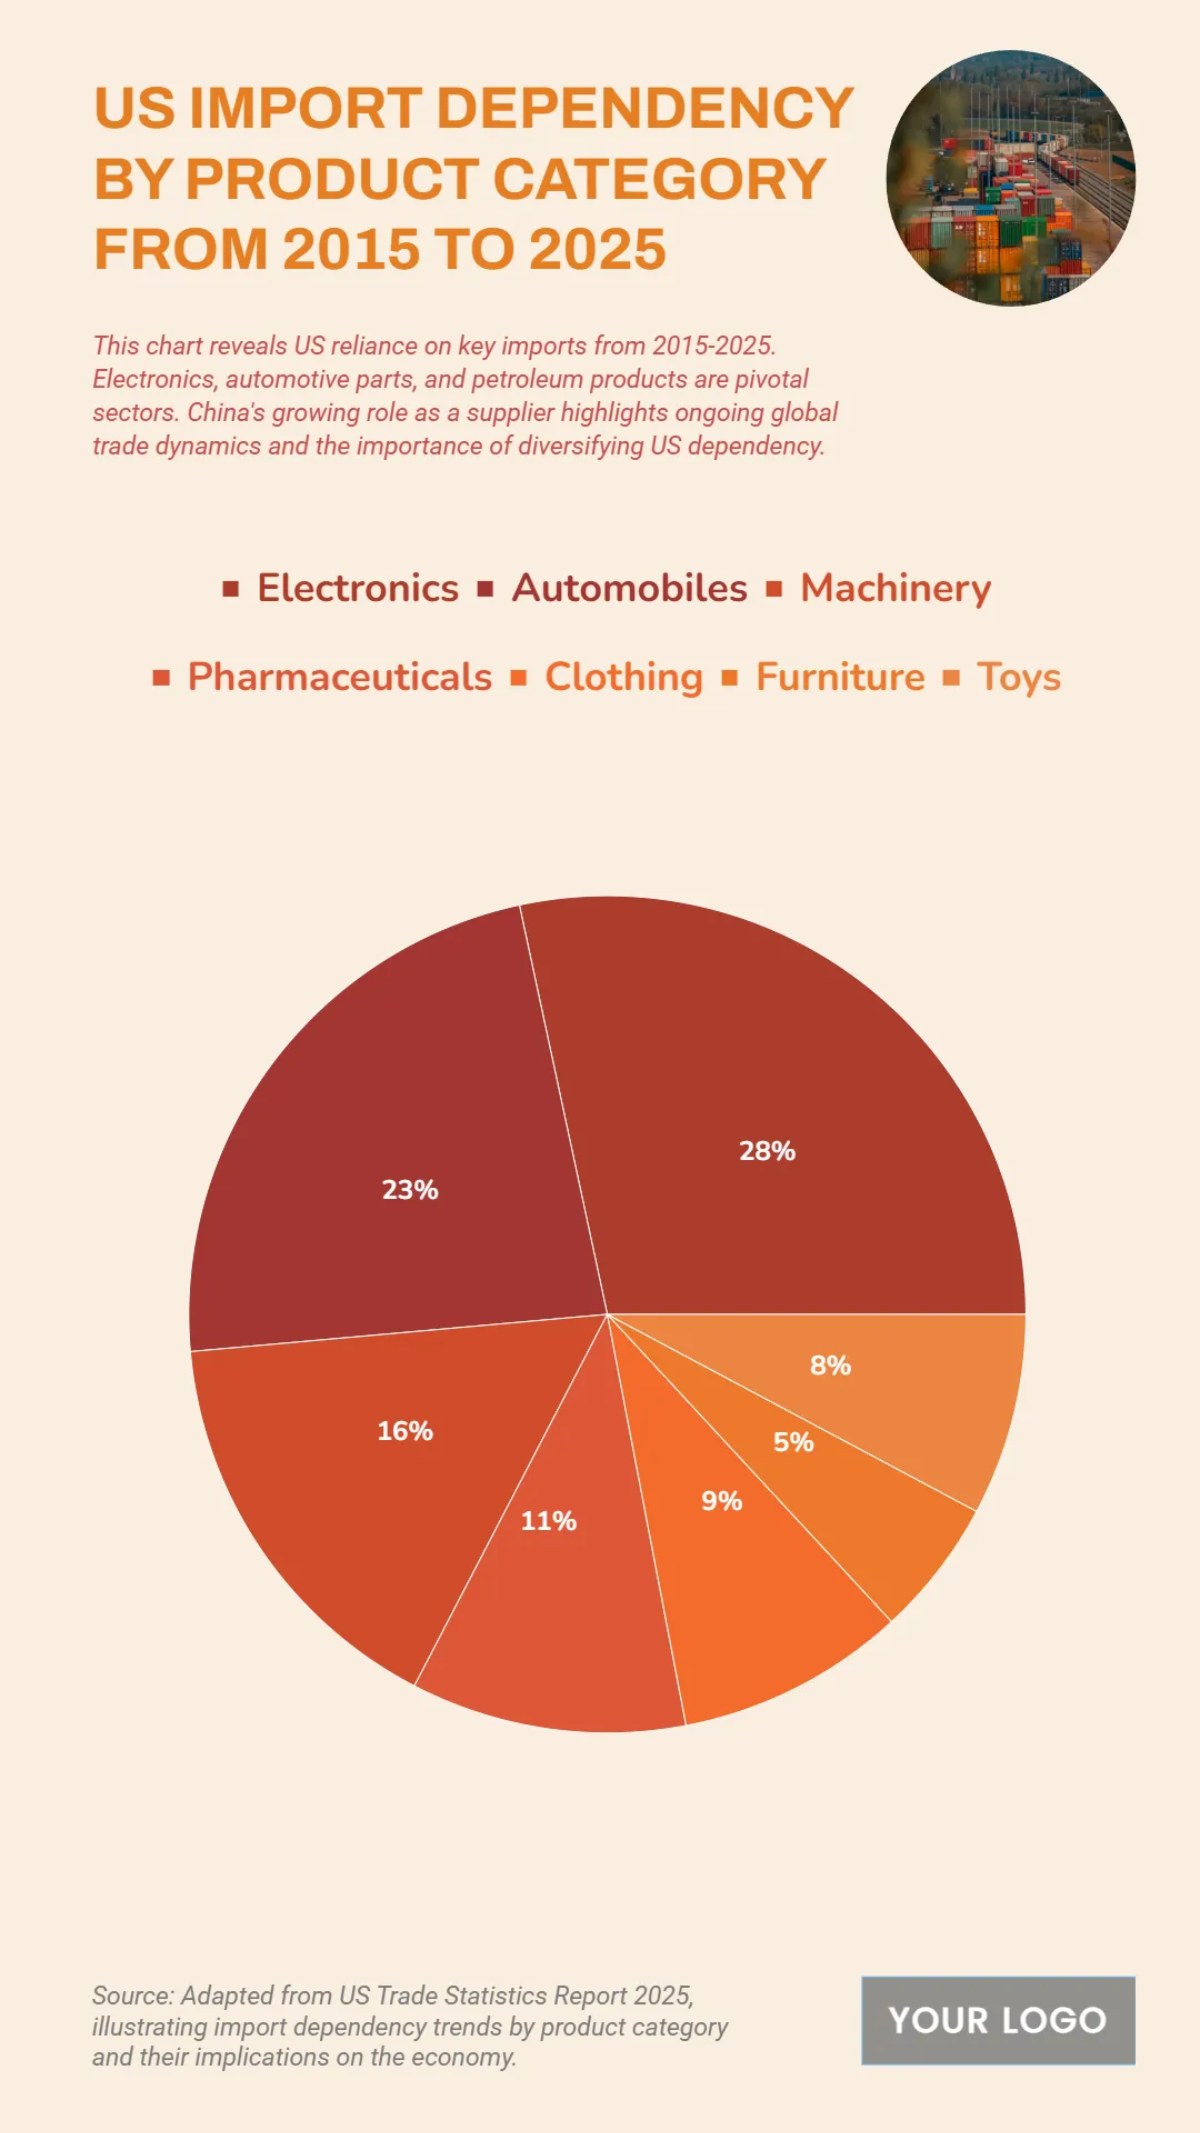
The chart illustrates the breakdown of US import dependency across product categories between 2015 and 2025. Electronics account for the largest share at 26%, followed by Automobiles at 22%, and Machinery at 16%. Pharmaceuticals represent 11%, while Clothing makes up 9%. Furniture and Toys are smaller categories, contributing 8% and 6%, respectively.
| Labels | Import Value (in Billion USD) |
|---|---|
| Electronics | 800 |
| Automobiles | 650 |
| Machinery | 450 |
| Pharmaceuticals | 300 |
| Clothing | 250 |
| Furniture | 150 |
| Toys | 220 |
You may also like
- Bar Graph Chart
- Line Graph Chart
- Pie Graph Chart
- Table Graph Chart
- Scatter Graph Chart
- Area Graph Chart
- Tree Graph Chart
- Birth Chart
- Chore Chart
- Time Table Chart
- Dress Size Chart
- Football Depth Chart
- Color Chart
- Color Wheel Chart
- Color Mix Chart
- Classroom Seating Chart
- Church Organizational Chart
- Hierarchy Organizational Chart
- Tree Organizational Chart
- Organization Chart
- Time Chart
- Blood Pressure Chart
- Behavior Chart
- Process Flowchart
- Process Flow Chart
- Baby Feeding Chart
- BMI Chart
- Ring Size Chart
- Height Chart
- Number Chart
- Food Chart
- Baby Milestones Chart
- Blood Sugar Chart
- Body Temperature Chart
- Diet Chart
- Metric Chart
- Pregnancy Weight Gain Chart
- HCG Levels Chart
- Astrology Chart
- Blood Oxygen Level Chart
- Gauge Chart
- Sales Chart
- Marketing Chart
- Military Time Chart
- Pregnancy Food Chart
- Medical Chart
- Wedding Seating Chart
- Guitar Chord Chart
- Pedigree Chart
- Natal Chart
- Team Organizational Chart
- Feelings Chart
- Piano Chord Chart
- Shoe Size Chart
- Activity Chart
- Height Weight
- Eye Chart
- Chakra Chart
- Reflexology Chart
- Hospital Organizational Chart
- Radar Chart
- College Organizational Chart
- Column Chart
- Roman Numerals Chart
- Weather Chart
- Height Conversion Chart
- Food Calorie Chart
- Fundraising Chart
- Kids Chore Chart
- Donut Chart
- Incident Flow Chart
- Patient Chart
- Body Measurement Chart
- Synastry Chart
- Funnel Chart
- Goal Chart
- Weight Loss Chart
- Money Chart
- Research FlowChart
- Medical Organizational Chart
- Protein Chart
- Retail Organizational Chart
- Sports Organizational Chart
- Vitamin Chart
- Research Gantt Chart
- To Do Chart
- Tooth Chart
- Conjugation Chart
- Drug Chart
- Event FlowChart
- Gildan Size Chart
- Logistics Organizational Chart
- Production FlowChart
- Bank Organizational Chart
- Dental Chart
- Dissertation Gantt Chart
- Training Gantt Chart
- Warehouse Organizational Chart
- Army Weight Chart
- Communication FlowChart
- Face Chart
- Pharma Organizational Chart
- Travel Gantt Chart
- Gaming FlowChart
- Insurance Organizational Chart
- Manufacturing Chart
- Progress Chart
- Travel Organizational Chart
- Charity FlowChart
- Design Firm/Company Organizational Chart
- Hospital Gantt Chart
- Manufacturing Gantt Chart
- Recruitment Gantt Chart
- Website Gantt Chart
- Environment Organizational Chart
- Fire Organizational Chart


