Free US Household Net Worth Growth by State from 2020 to 2025
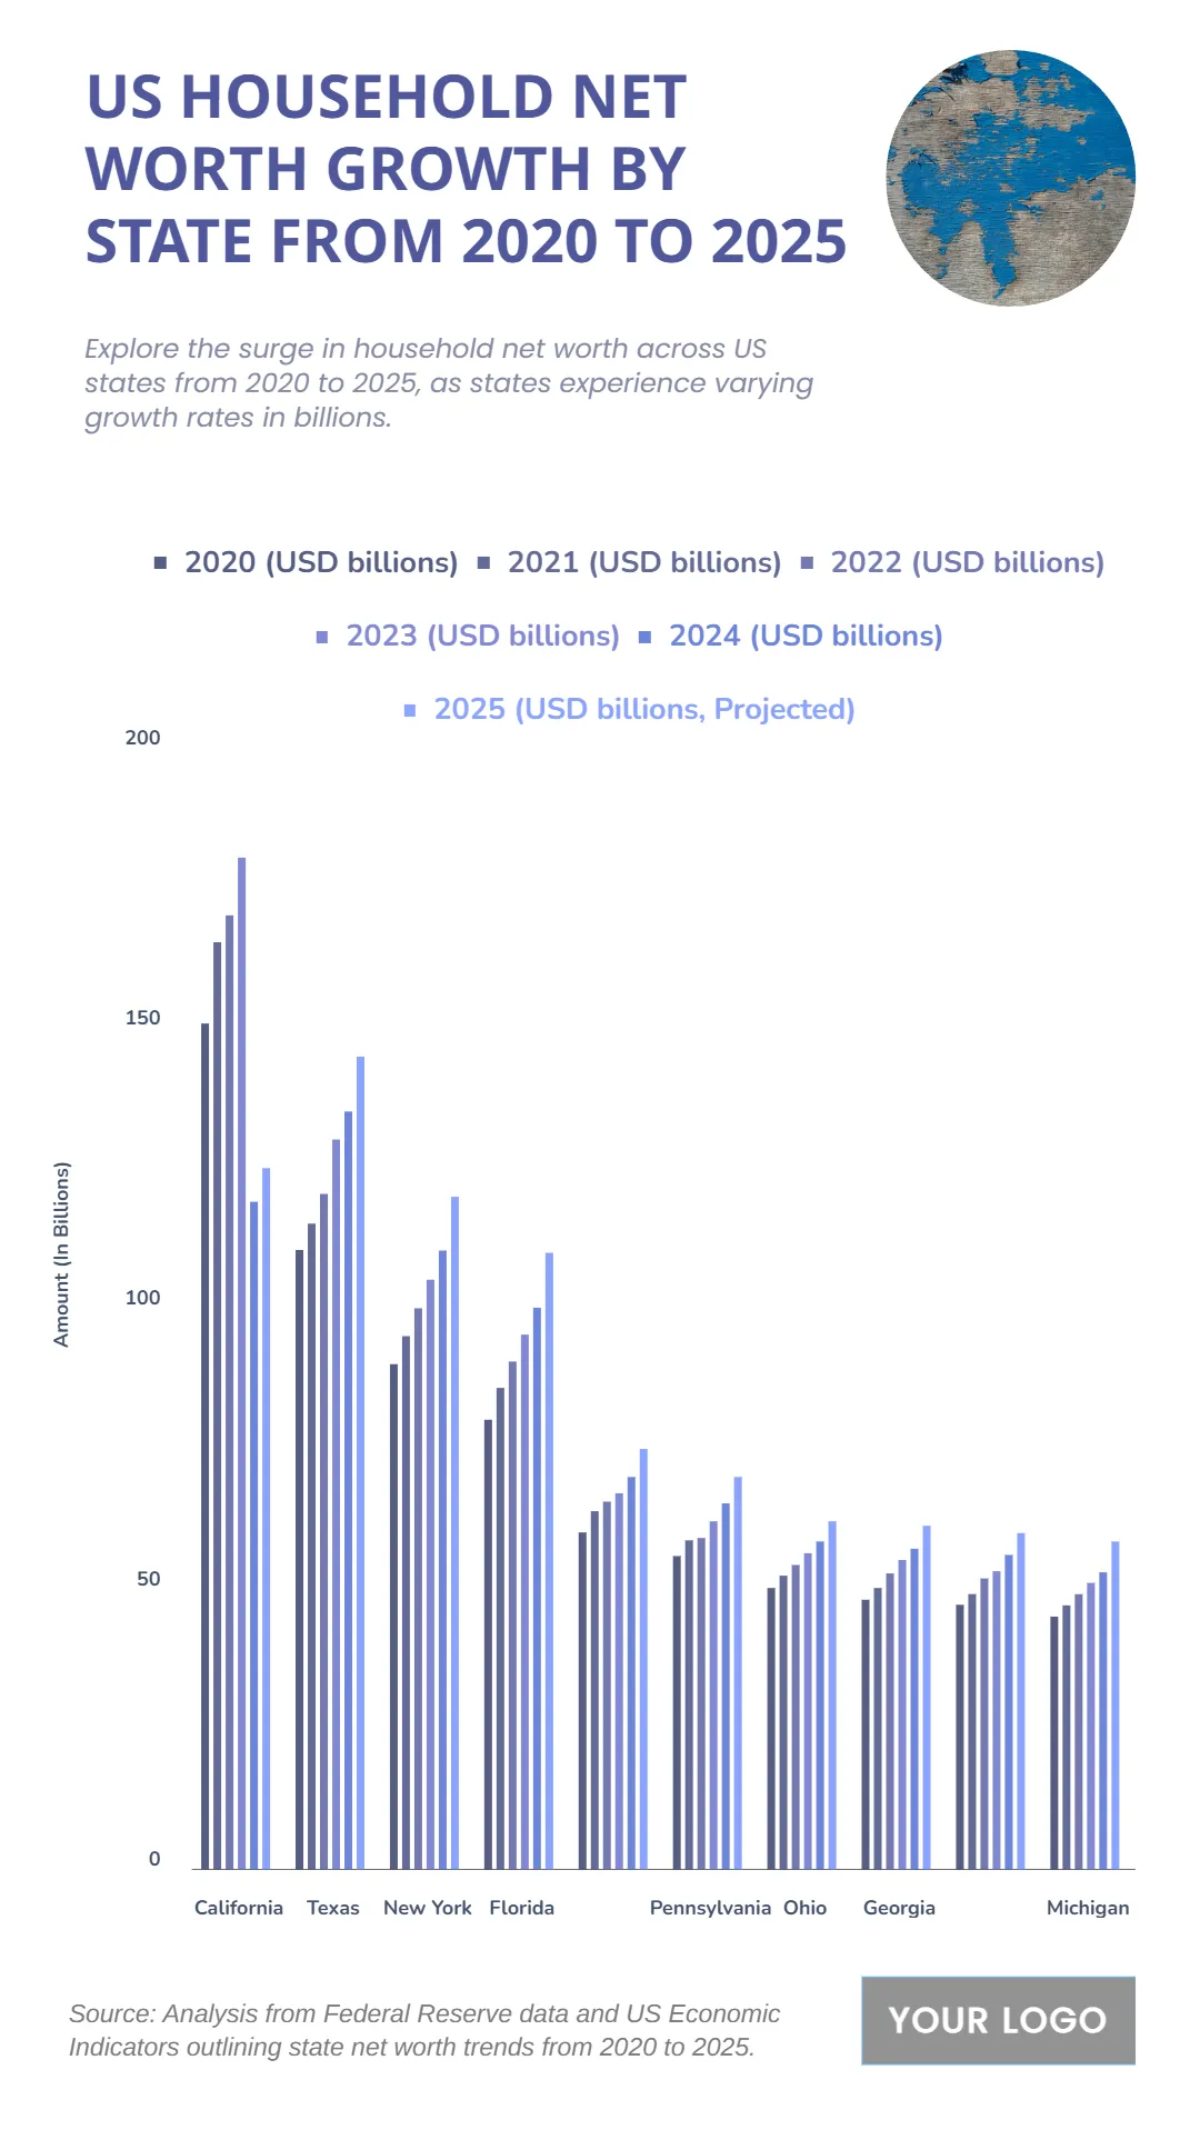
The chart provides an overview of US household net worth growth by state from 2020 to 2025, revealing a consistent and significant upward trend across all states analyzed. California holds the highest growth, increasing from approximately $160 billion in 2020 to a projected $180 billion in 2025. Texas and New York follow, with Texas’s net worth growing from around $120 billion to $150 billion and New York’s from $90 billion to $120 billion over the period. This widespread increase is driven by factors like rising asset values and economic expansion. The data shows that the nation's most populous states are leading in household wealth accumulation.
| Labels | 2020 (USD billions) | 2021 (USD billions) | 2022 (USD billions) | 2023 (USD billions) | 2024 (USD billions) | 2025 (USD billions, Projected) |
|---|---|---|---|---|---|---|
| California | 150.9 | 165.4 | 170.2 | 180.5 | 119.1 | 125.1 |
| Texas | 110.5 | 115.2 | 120.5 | 130.2 | 135.2 | 145 |
| New York | 90.13 | 95.13 | 100.1 | 105.2 | 110.4 | 120 |
| Florida | 80.21 | 85.9 | 90.6 | 95.4 | 100.2 | 110 |
| Illinois | 60.11 | 63.9 | 65.6 | 67.1 | 70 | 75 |
| Pennsylvania | 55.9 | 58.7 | 59.12 | 62.1 | 65.3 | 70 |
| Ohio | 50.2 | 52.4 | 54.3 | 56.4 | 58.5 | 62.1 |
| Georgia | 48.1 | 50.2 | 52.8 | 55.2 | 57.2 | 61.3 |
| North Carolina | 47.2 | 49.11 | 51.9 | 53.2 | 56.1 | 60 |
| Michigan | 45.1 | 47.1 | 49.1 | 51.1 | 53 | 58.5 |


