Free US Logistics and Supply Chain Disruptions from 2015 to 2025
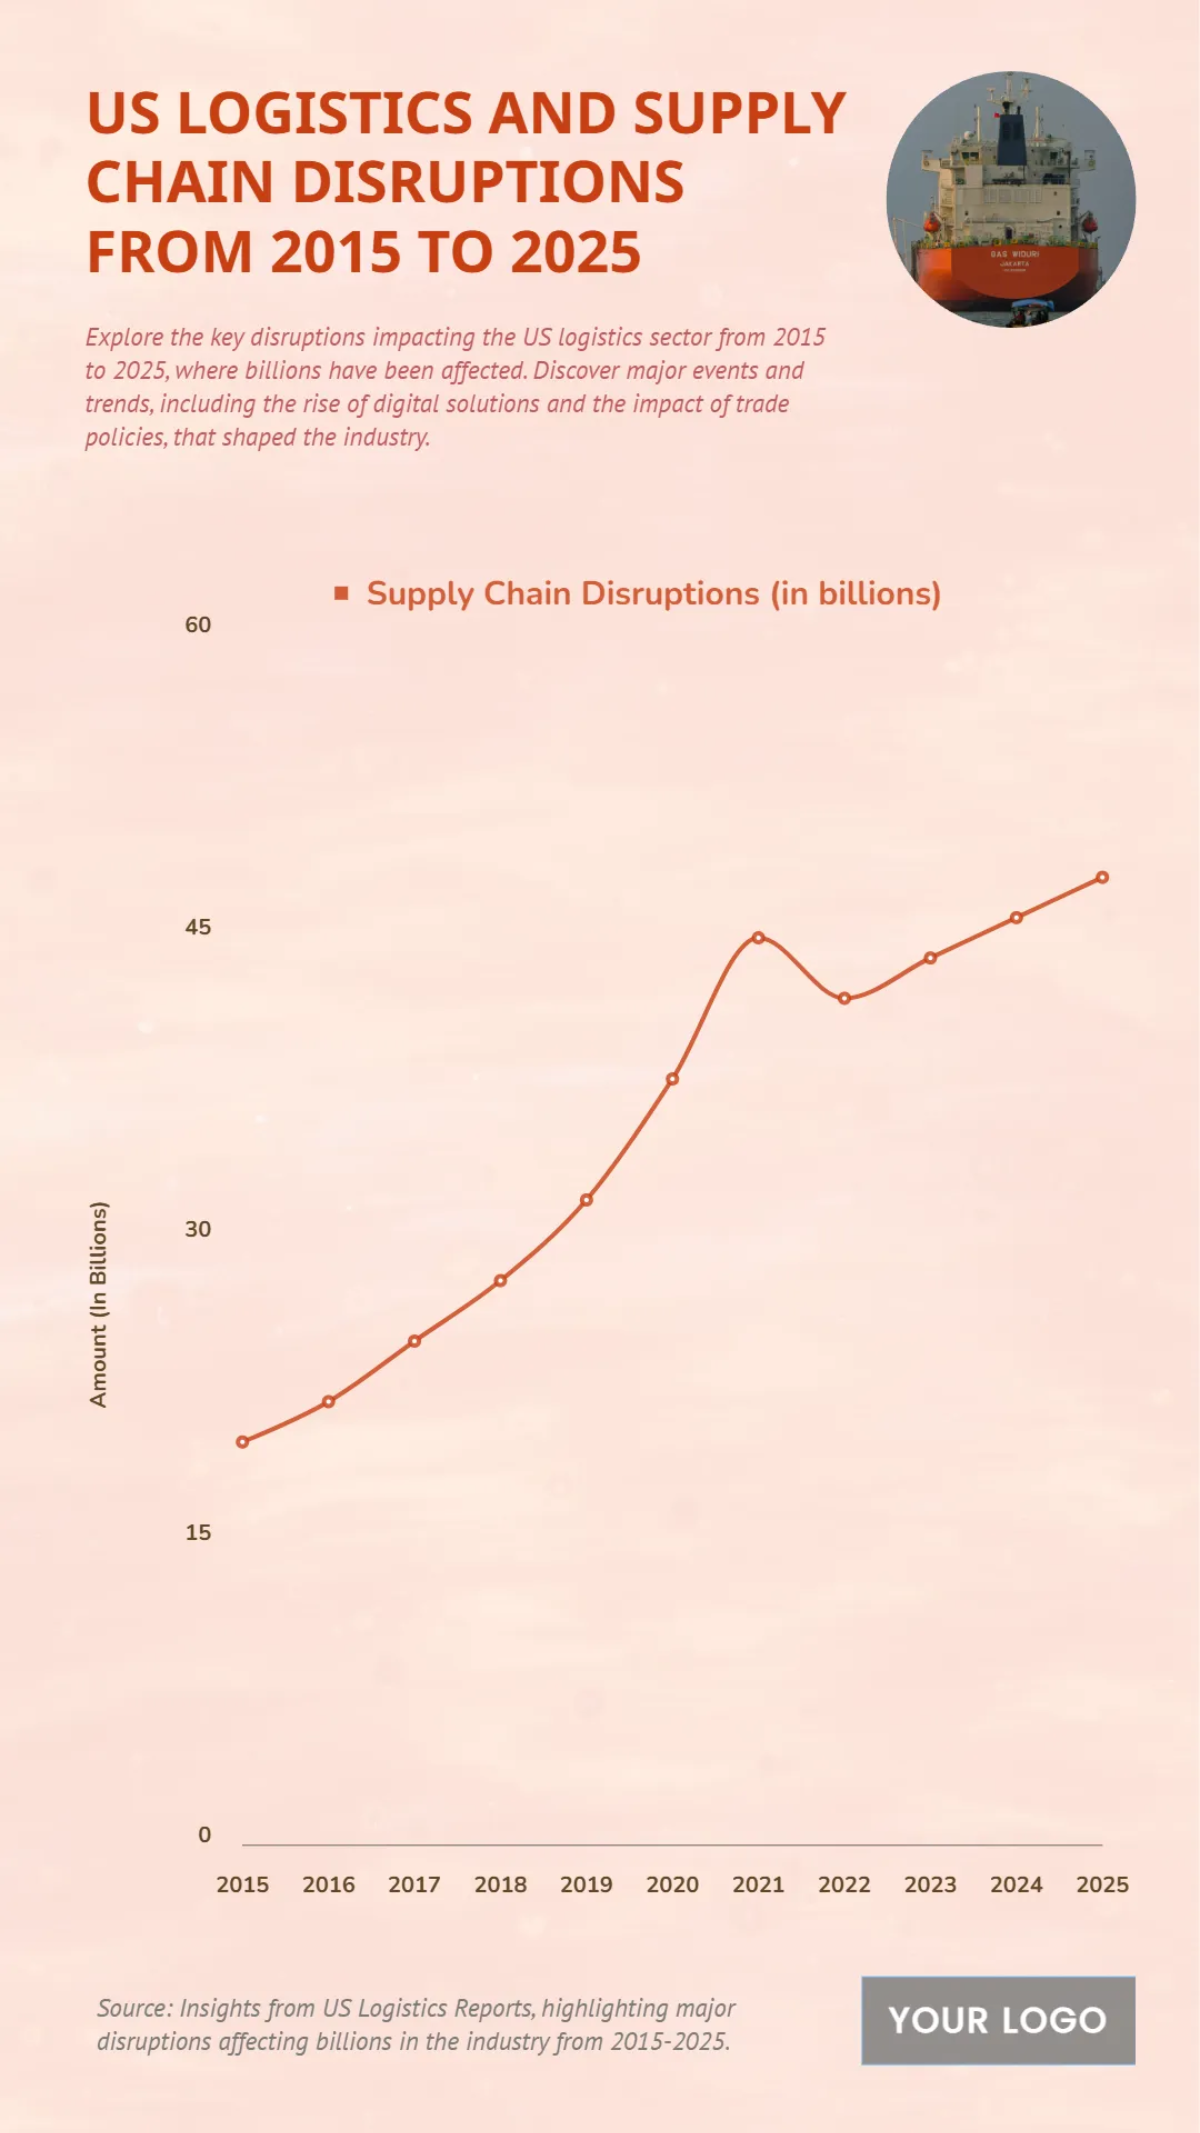
The chart tracks US logistics and supply chain disruptions from 2015 to 2025, measured in billions of dollars. In 2015, disruptions cost around $10 billion, rising steadily to $18 billion in 2017 and $28 billion by 2019. A sharp surge occurred in 2020, reaching about $45 billion, and peaking in 2021 at $60 billion, reflecting the severe impact of the pandemic, port congestion, and labor shortages. In 2022, disruptions declined to $50 billion as conditions partially stabilized, but costs rose again to $55 billion in 2023, $58 billion in 2024, and are projected to reach $62 billion in 2025.
| Labels | Supply Chain Disruptions (in billions) |
|---|---|
| 2015 | 20 |
| 2016 | 22 |
| 2017 | 25 |
| 2018 | 28 |
| 2019 | 32 |
| 2020 | 38 |
| 2021 | 45 |
| 2022 | 42 |
| 2023 | 44 |
| 2024 | 46 |
| 2025 | 48 |


