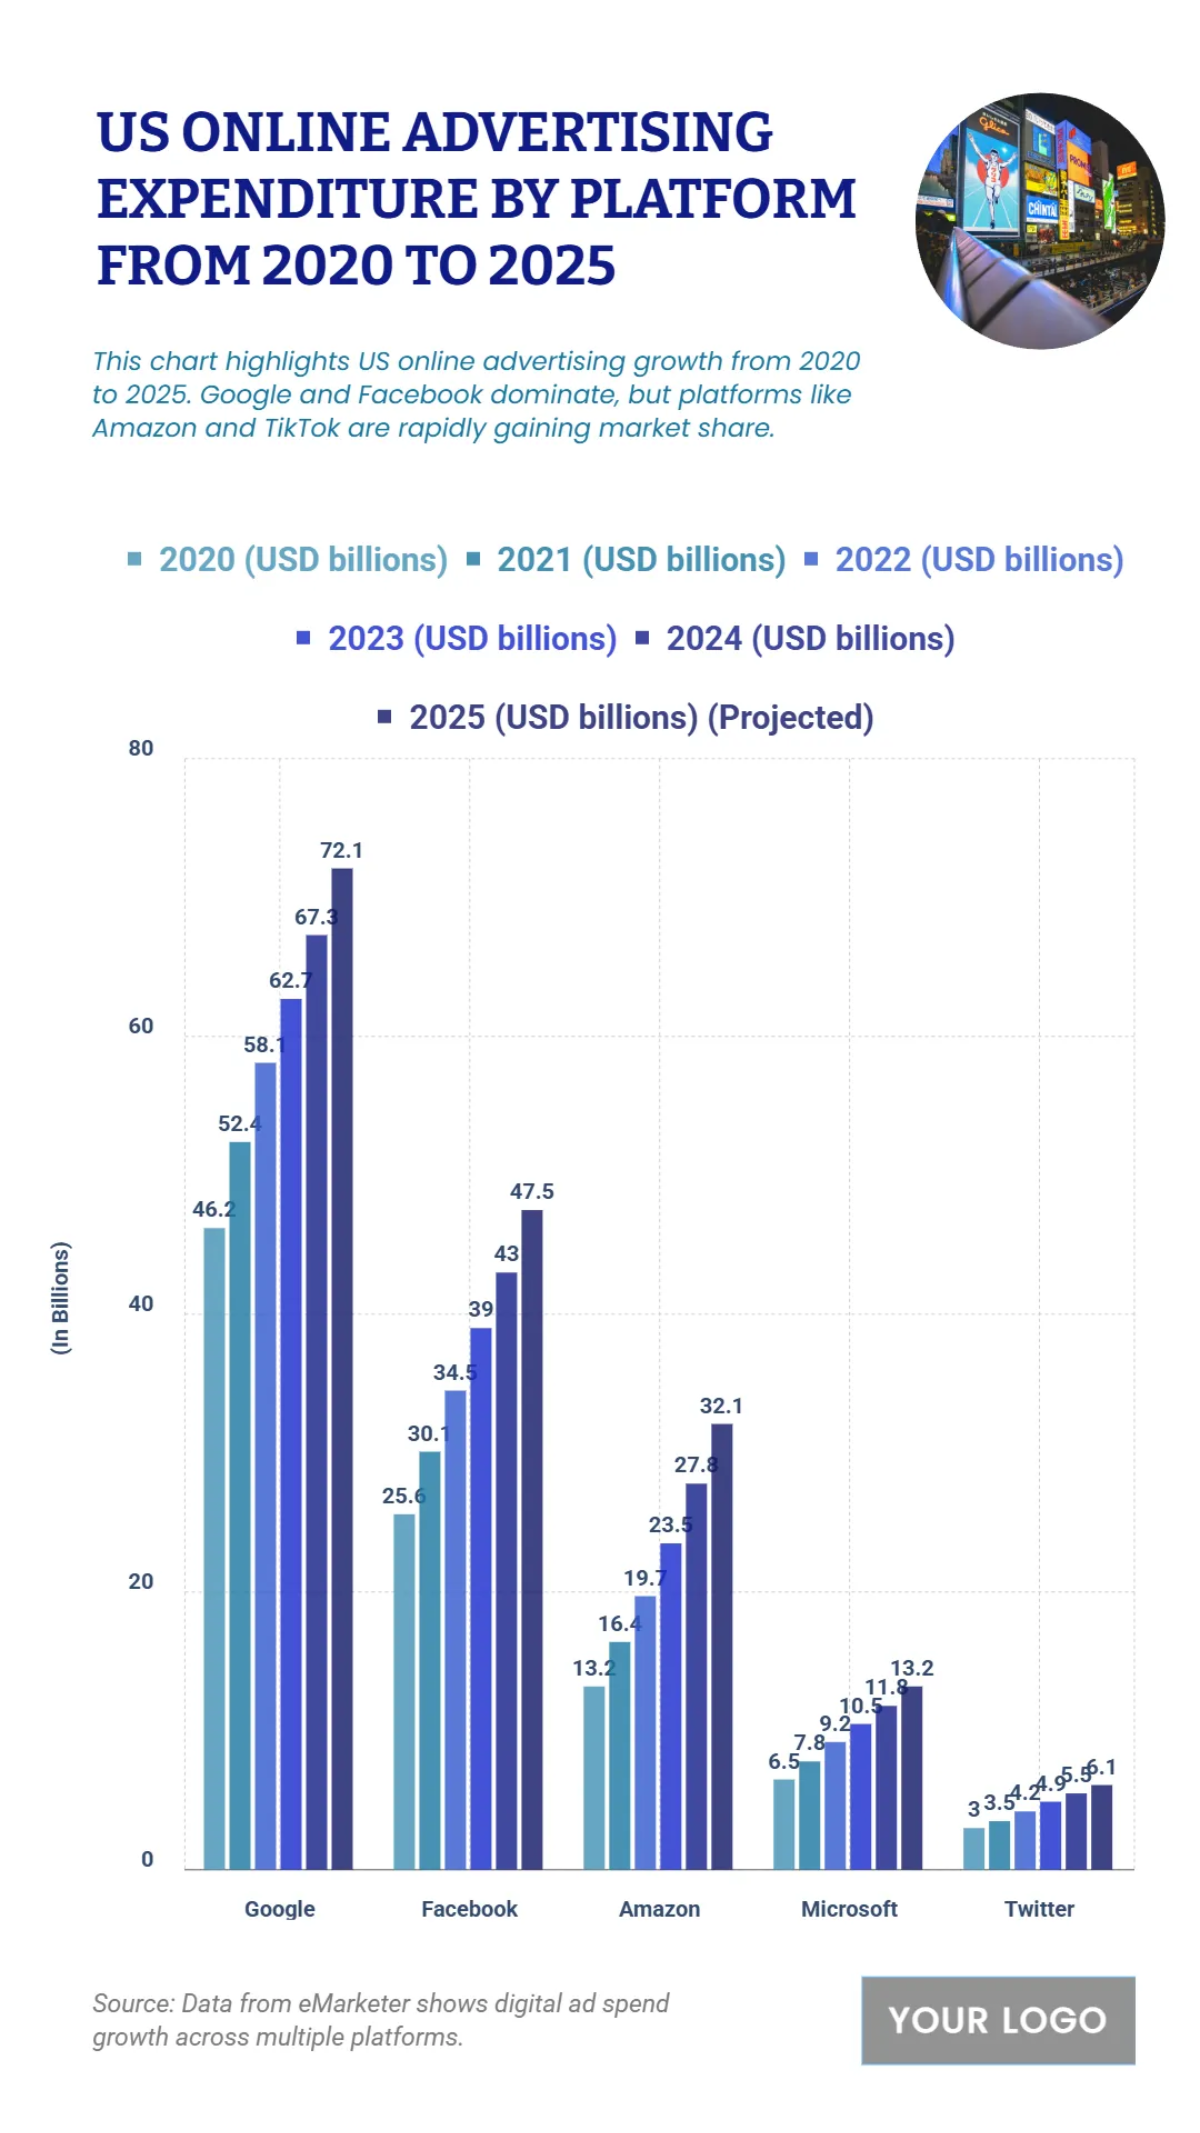
Free US Online Advertising Expenditure by Platform from 2020 to 2025
The chart illustrates U.S. online advertising expenditure growth across major platforms from 2020 to 2025. Google remains the dominant player, with ad spending increasing from around $45 billion in 2020 to a projected $72 billion by 2025, reflecting its stronghold in search and digital ads. Facebook follows, rising from $30 billion in 2020 to nearly $52 billion in 2025, driven by social media engagement and targeted ad solutions.
Amazon shows significant growth, expanding from $20 billion in 2020 to $36 billion in 2025, fueled by its e-commerce ecosystem and expanding ad services. Microsoft grows steadily from $10 billion in 2020 to $18 billion in 2025, benefiting from its search and professional networks. Twitter, though smaller in scale, increases from $5 billion in 2020 to about $9 billion in 2025, maintaining relevance within niche markets.
This data highlights the accelerating competition within digital advertising, with Google and Facebook maintaining dominance, while Amazon’s rapid ascent reshapes the ad market and smaller platforms steadily carve out their shares.
| Labels | 2020 (USD billions) | 2021 (USD billions) | 2022 (USD billions) | 2023 (USD billions) | 2024 (USD billions) | 2025 (USD billions) (Projected) |
|---|---|---|---|---|---|---|
| 46.2 | 52.4 | 58.1 | 62.7 | 67.3 | 72.1 | |
| 25.6 | 30.1 | 34.5 | 39 | 43 | 47.5 | |
| Amazon | 13.2 | 16.4 | 19.7 | 23.5 | 27.8 | 32.1 |
| Microsoft | 6.5 | 7.8 | 9.2 | 10.5 | 11.8 | 13.2 |
| 3 | 3.5 | 4.2 | 4.9 | 5.5 | 6.1 |


