Free Top 5 U.S. Retirement Fund Assets by Type (2015-2025)
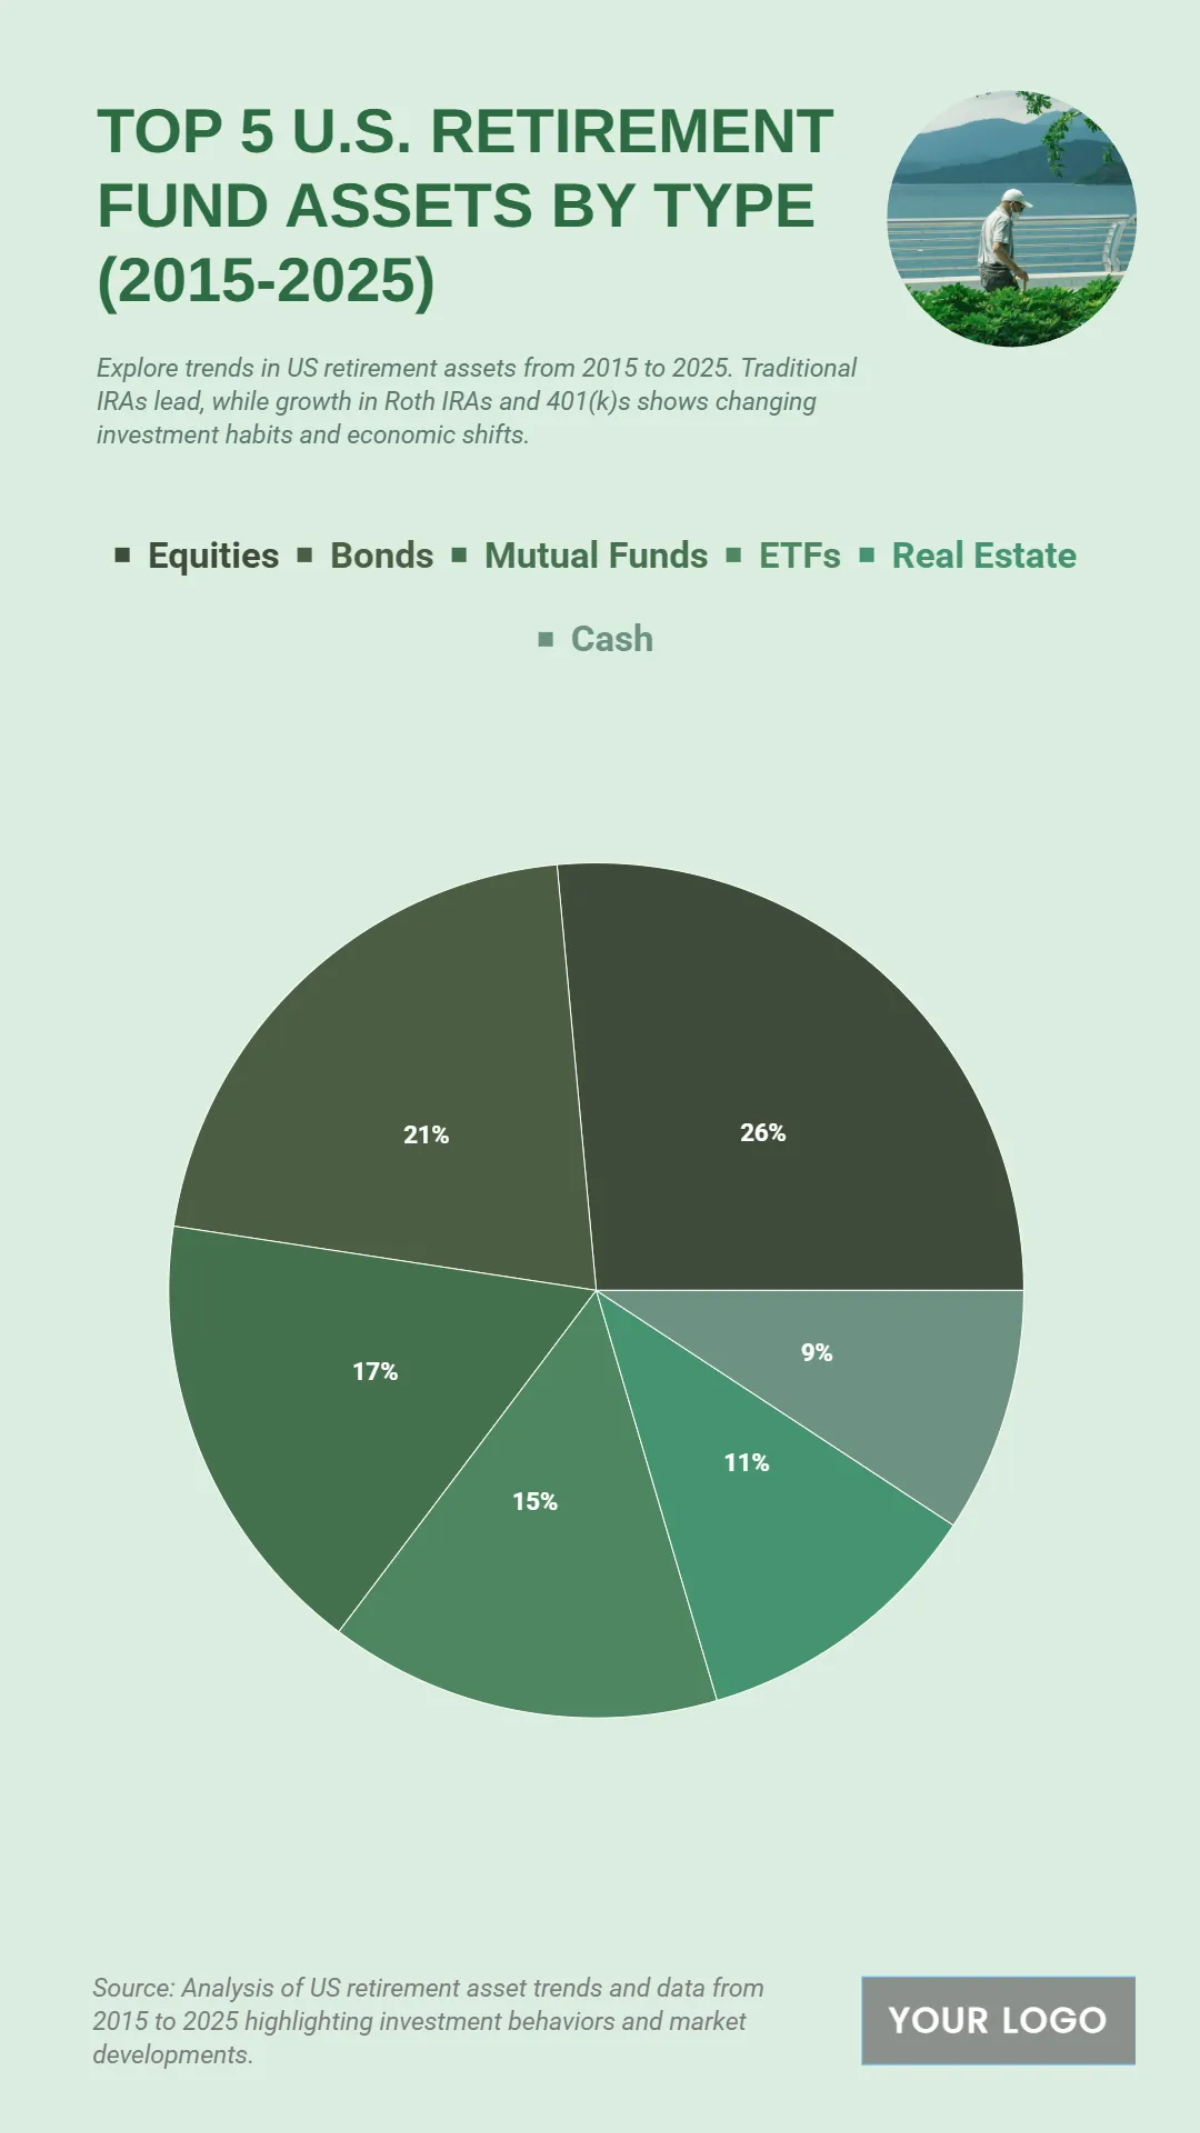
Based on the pie chart titled "US Retirement Fund Assets by Type from 2015 to 2025", the distribution of assets within U.S. retirement funds is clearly outlined. The data shows that a significant portion of these funds is allocated to traditional assets, with Equities accounting for the largest share at 29%. Bonds represent the second-largest portion, making up 25% of the total assets. The chart also details the allocation to other asset classes, including Mutual Funds at 16%, and a smaller but still significant portion in Cash at 14%. Additionally, ETFs (Exchange-Traded Funds) and Real Estate each represent 11% and 9% of the total assets, respectively. The remaining 3% is categorized as Other assets. This breakdown highlights the dominance of equities and bonds in U.S. retirement portfolios, while also indicating a shift in investment habits with the inclusion of assets like ETFs. The chart provides a comprehensive overview of how retirement assets were distributed from 2015 to 2025.
| Labels | Assets in Billions (USD) |
|---|---|
| Equities | 15.15 |
| Bonds | 12.1 |
| Mutual Funds | 9.8 |
| ETFs | 8.5 |
| Real Estate | 6.4 |
| Cash | 5.3 |


