Free Top 10 U.S. States by Average Hourly Wage (2020-2025)
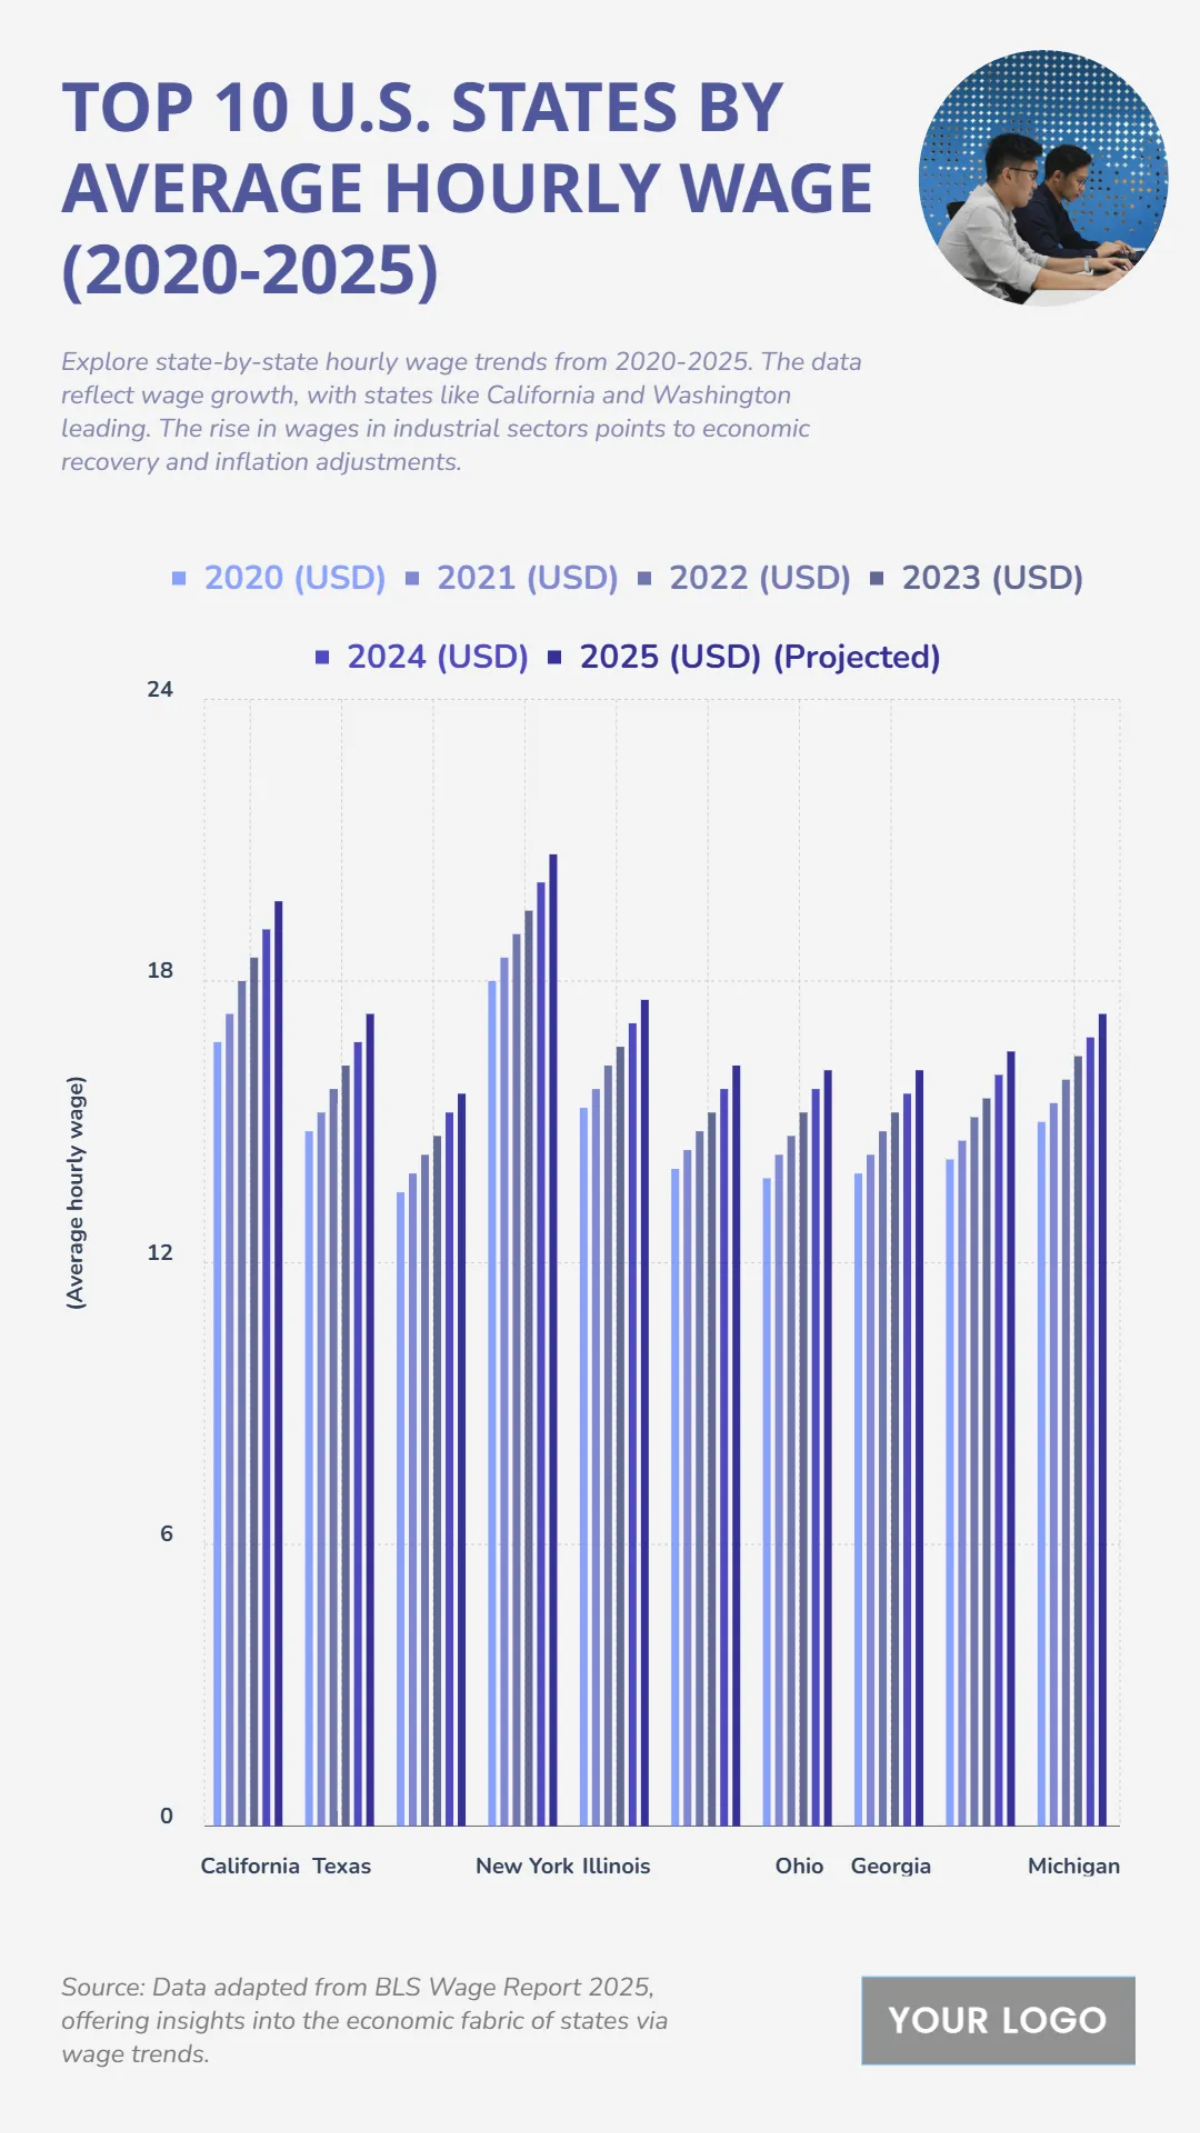
Based on the bar chart titled "US AVERAGE HOURLY WAGE BY STATE FROM 2020 TO 2025", a clear trend of increasing average hourly wages is evident across the presented states. The data, presented in USD, shows a consistent rise from 2020 to the projected figures for 2025. Among the states shown, New York appears to lead in average hourly wage, with a projected value reaching approximately 21 USD by 2025. California also shows strong wages, rising from around 18 USD in 2020 to over 20 USD in 2025. Other states, while having lower wages, also demonstrate significant growth. For instance, Texas and Illinois both show their average hourly wages increasing from about 15 USD in 2020 to a projected 17 USD in 2025. States such as Ohio and Georgia saw wages increase from approximately 13 USD to 15 USD during the same period. The overall upward trajectory across all states reflects a broad economic recovery and continuous wage growth over the six-year period.
| Labels | 2020 (USD) | 2021 (USD) | 2022 (USD) | 2023 (USD) | 2024 (USD) | 2025 (USD) (Projected) |
|---|---|---|---|---|---|---|
| California | 16.7 | 17.3 | 18 | 18.5 | 19.1 | 19.7 |
| Texas | 14.8 | 15.2 | 15.7 | 16.2 | 16.7 | 17.3 |
| Florida | 13.5 | 13.9 | 14.3 | 14.7 | 15.2 | 15.6 |
| New York | 18 | 18.5 | 19 | 19.5 | 20.1 | 20.7 |
| Illinois | 15.3 | 15.7 | 16.2 | 16.6 | 17.1 | 17.6 |
| Pennsylvania | 14 | 14.4 | 14.8 | 15.2 | 15.7 | 16.2 |
| Ohio | 13.8 | 14.3 | 14.7 | 15.2 | 15.7 | 16.1 |
| Georgia | 13.9 | 14.3 | 14.8 | 15.2 | 15.6 | 16.1 |
| North Carolina | 14.2 | 14.6 | 15.1 | 15.5 | 16 | 16.5 |
| Michigan | 15 | 15.4 | 15.9 | 16.4 | 16.8 | 17.3 |


