Free Top 10 U.S. States by Agricultural Employment (2015-2025) Chart
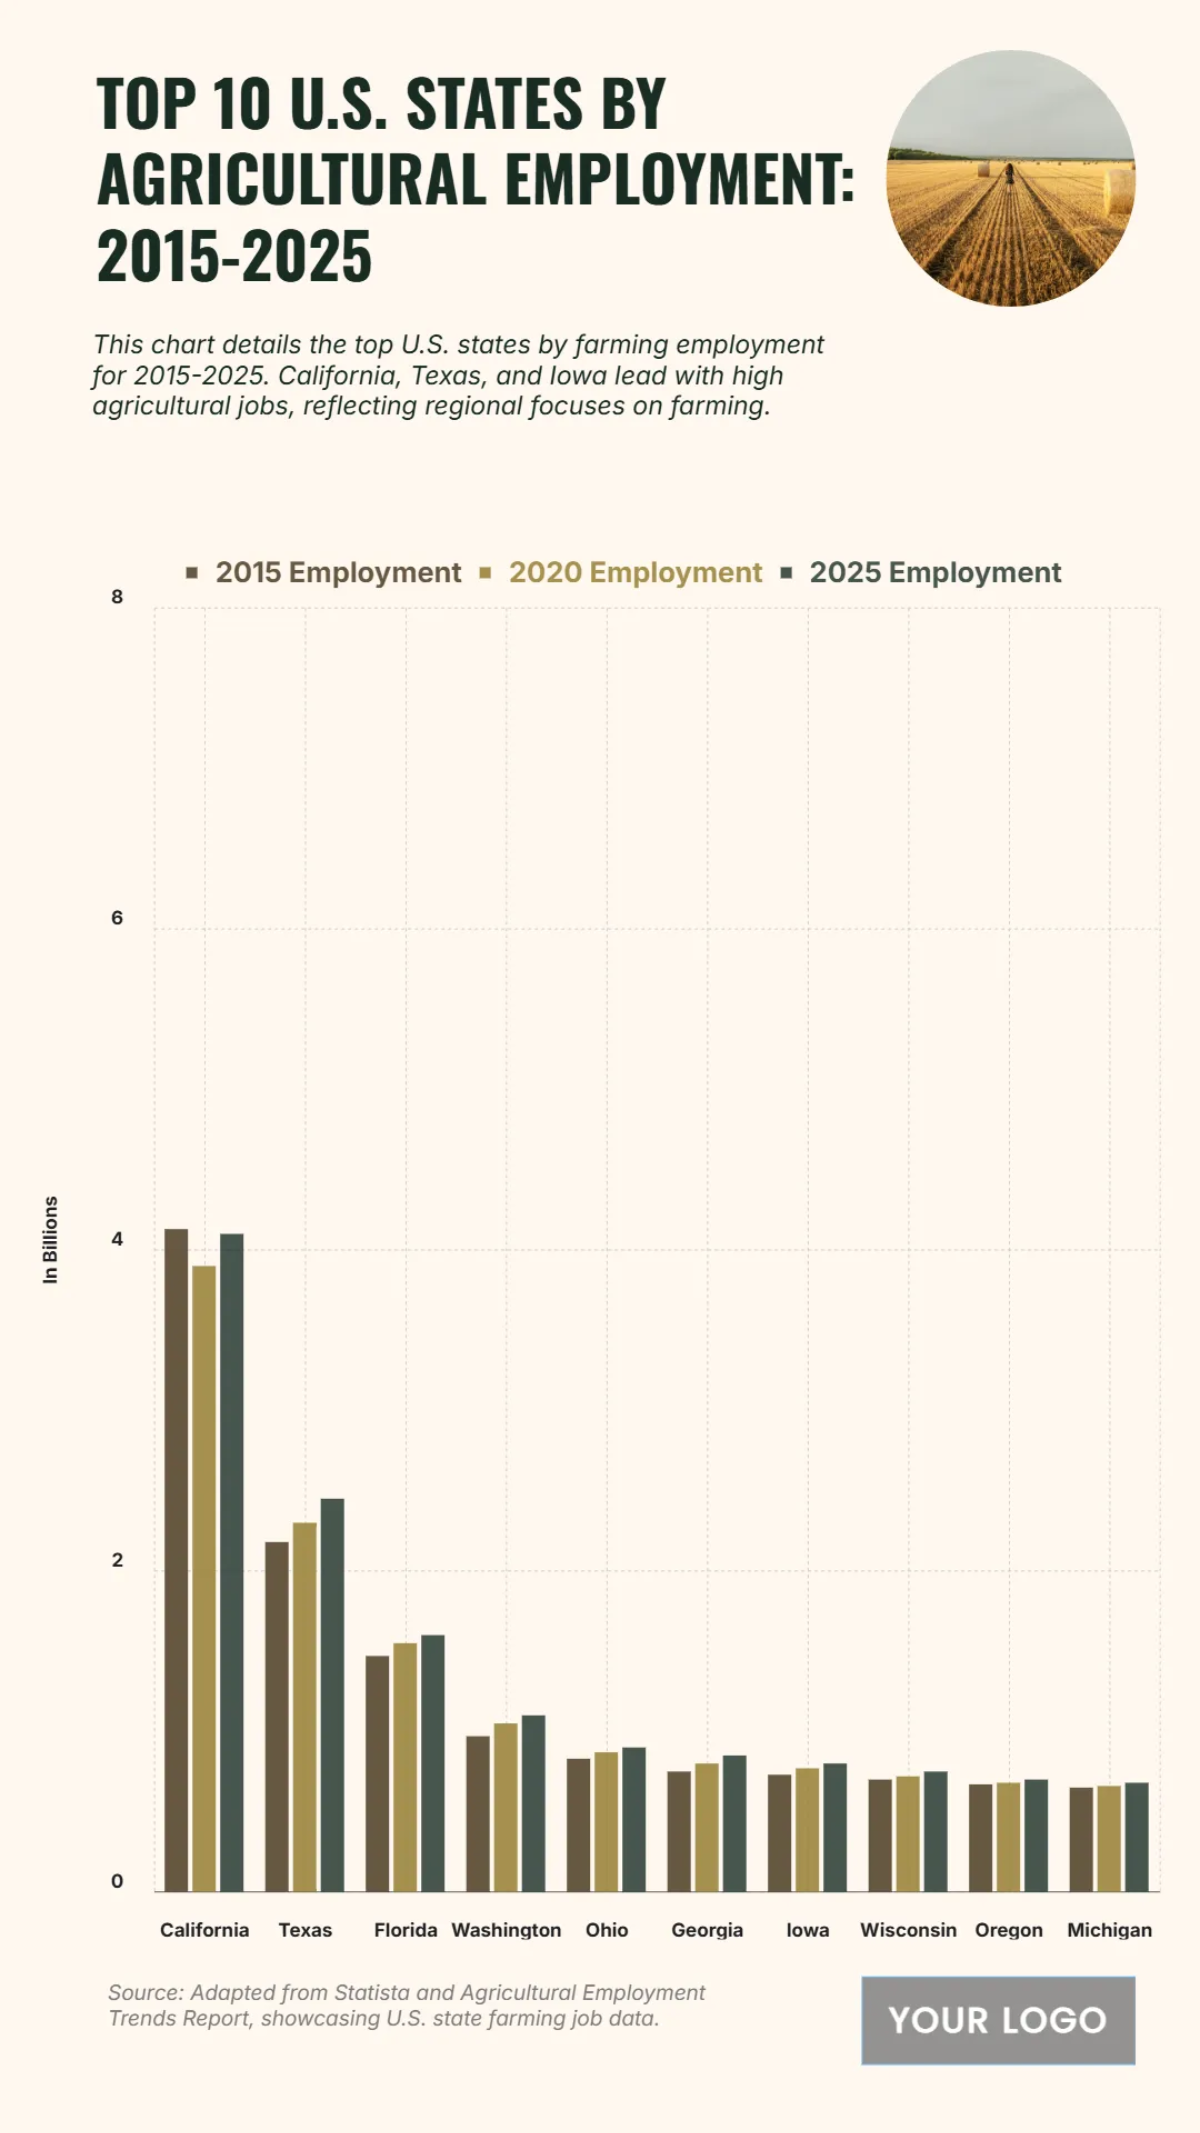
This chart details the top 10 U.S. states by agricultural employment, presenting data for 2015, 2020, and a projection for 2025. According to the chart's scale, California is the definitive leader, although it exhibits a slight declining trend with employment figures decreasing from approximately 4.1 billion in 2015 to a projected 3.8 billion by 2025. In contrast, Texas holds the second position and shows steady growth, with its employment numbers expected to rise from 2.2 billion to 2.5 billion over the same decade. Florida follows this growth pattern, also showing a consistent increase. The remaining states in the top ten, including agricultural hubs like Iowa, Washington, and Georgia, generally show stable to slightly increasing employment levels, with most hovering near the 1 billion mark. The chart overall highlights California's sustained dominance in farm employment, with all figures presented on a scale of billions.


