Free Top 5 U.S. Shipping and Port Activity by Region (2015-2025) Chart
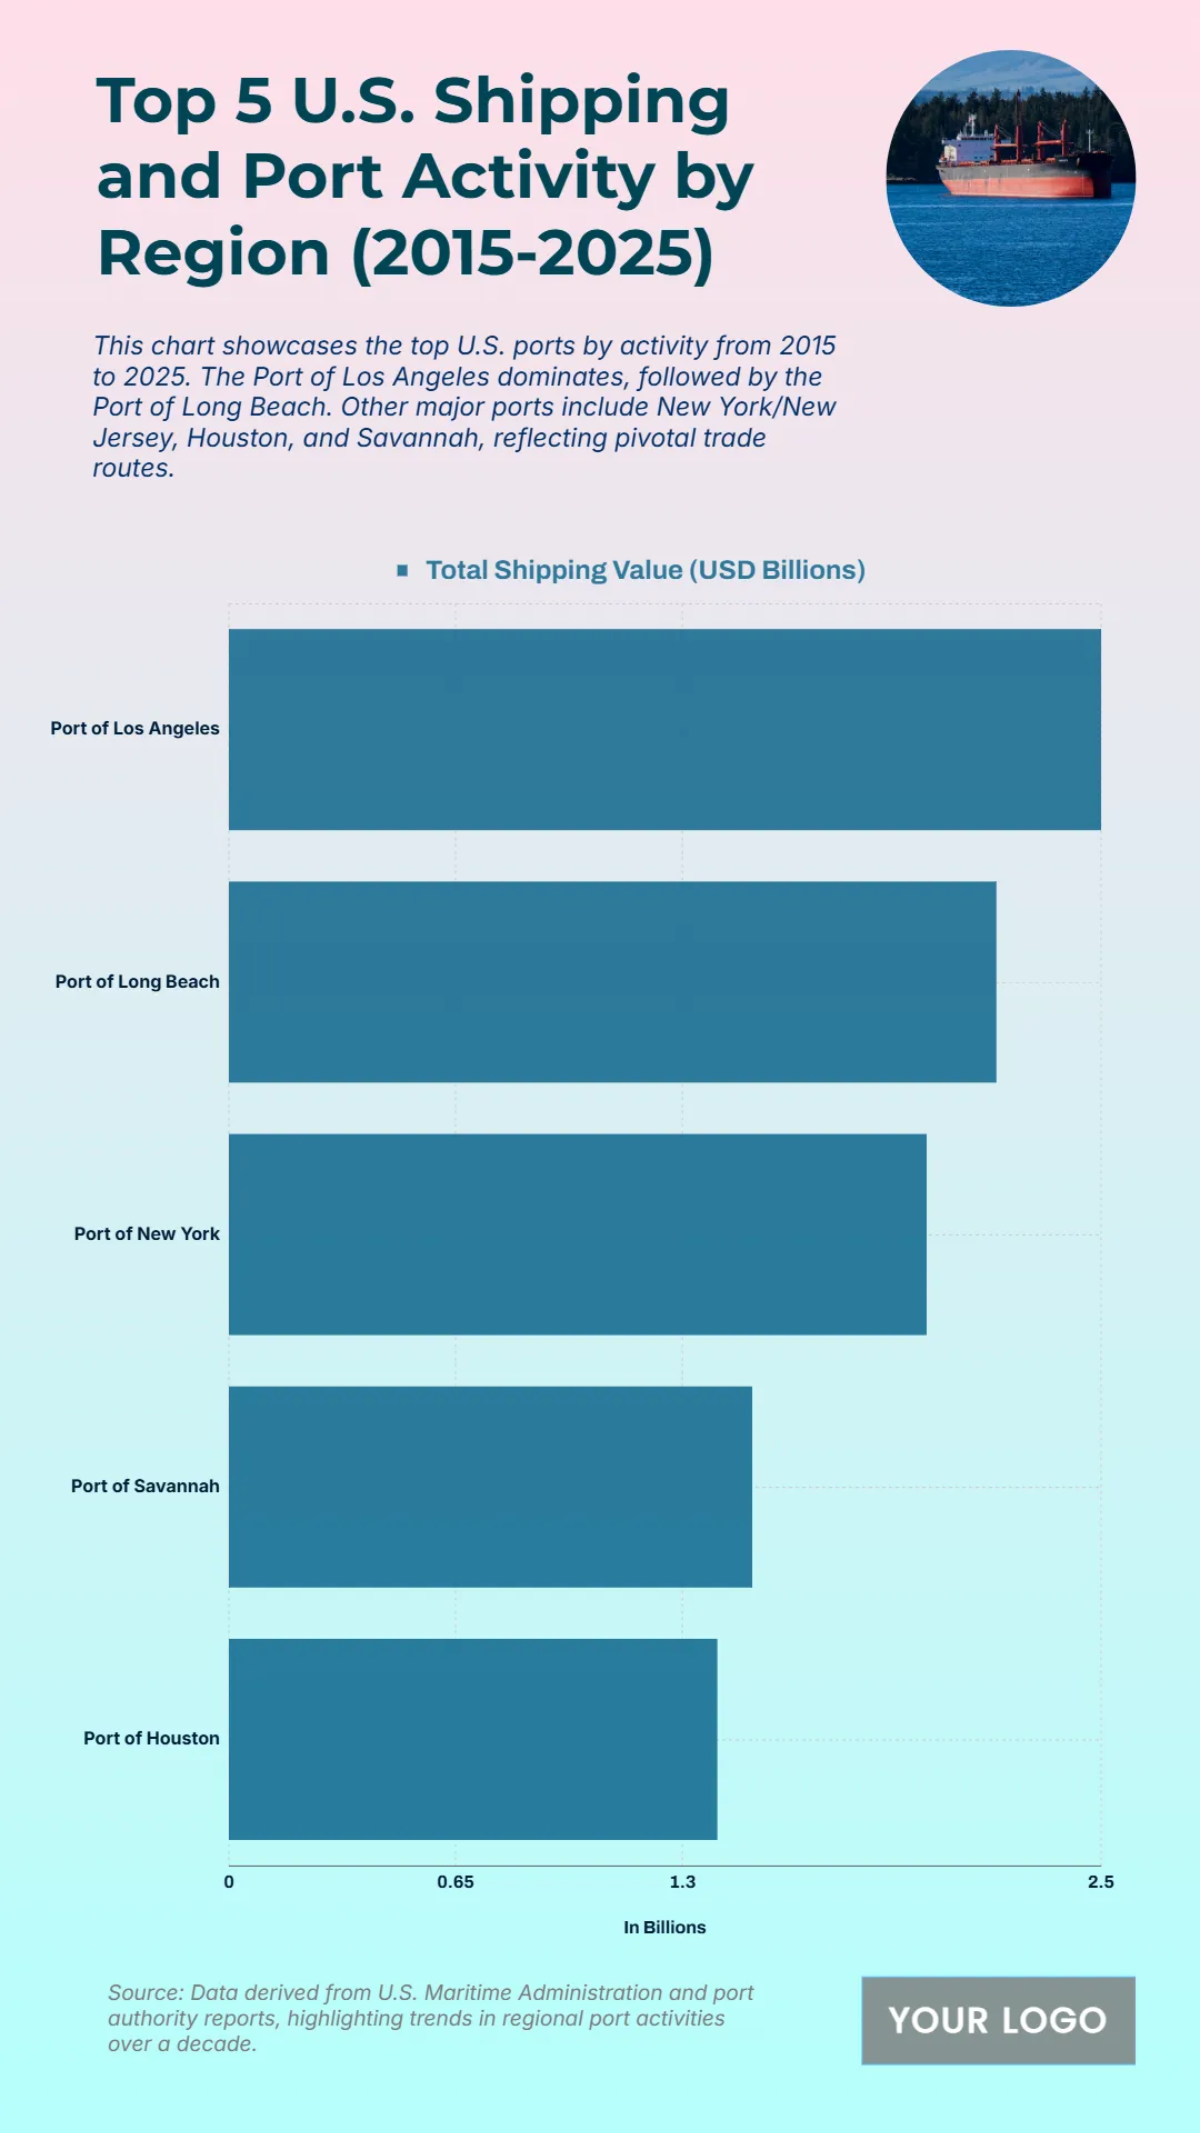
Based on the bar chart titled "Top 5 U.S. Shipping and Port Activity by Region (2015-2025)", a clear hierarchy of the top U.S. ports is established based on total shipping value. The chart, which covers a ten-year period, highlights the dominance of West Coast ports. The Port of Los Angeles is the leading port with a total shipping value of 2.5 billion USD. It is followed closely by the Port of Long Beach, which has a total shipping value of 2.2 billion USD. The Port of New York holds the third position, with a total value of 2 billion USD. Further down the list, the Port of Savannah and the Port of Houston rank fourth and fifth, respectively, with shipping values of 1.5 billion USD and 1.4 billion USD. This data, sourced from U.S. Maritime Administration and port authority reports, provides a clear overview of the pivotal trade routes and the most active ports in the United States over the decade. The chart demonstrates the significant role these ports play in the national and global trade network.


