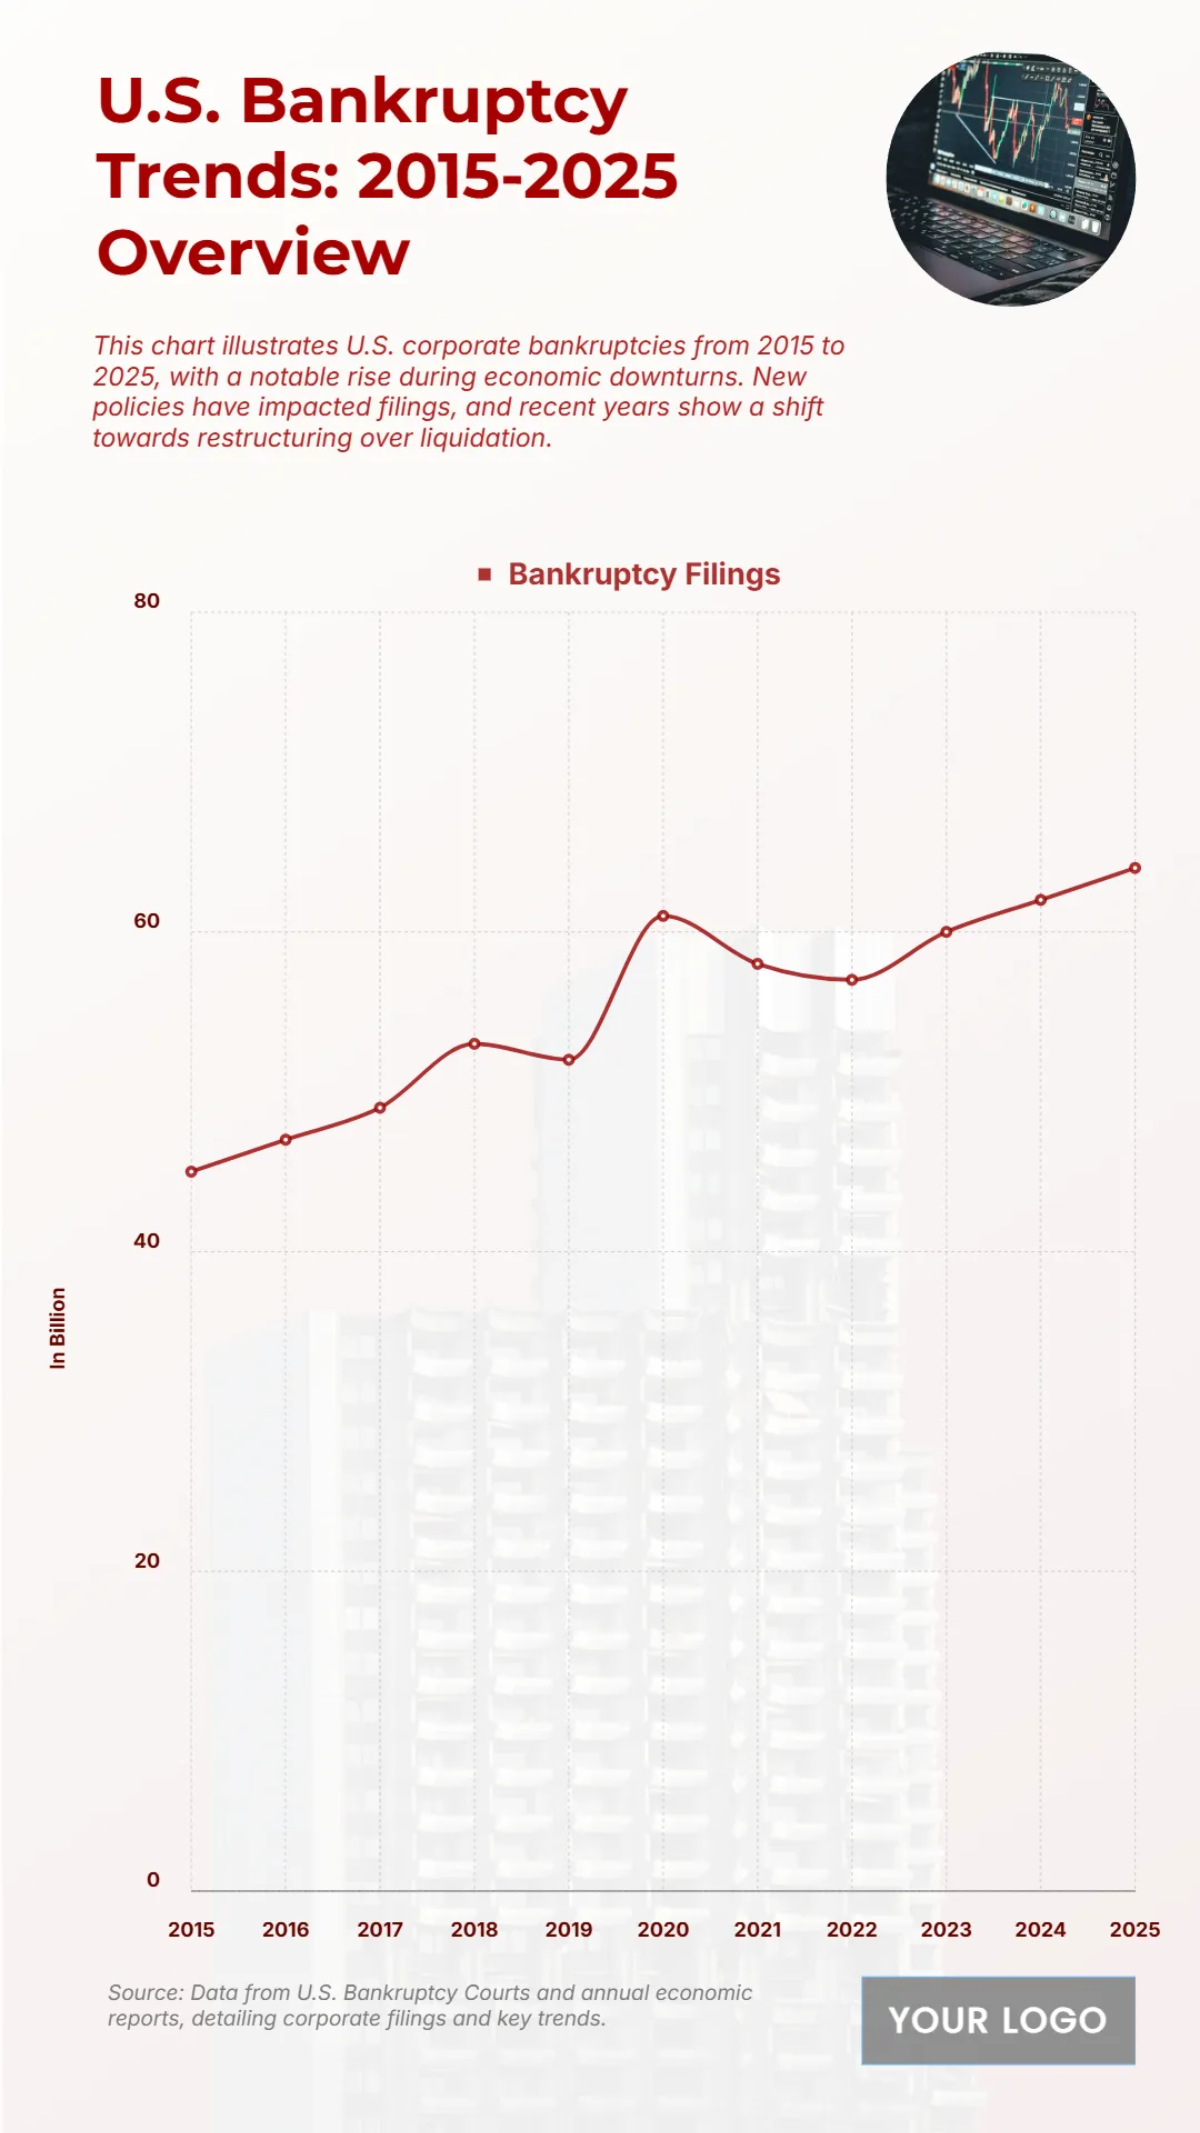
Free U.S. Corporate Bankruptcy Filings by Year (2015-2025) Chart
The chart shows U.S. corporate bankruptcy filings from 2015 to 2025, reflecting both economic cycles and policy impacts. Bankruptcies were at around 45 billion in 2015, gradually rising to 50 billion by 2018. A sharp increase occurred in 2020, peaking at nearly 62 billion, driven by the economic downturn and financial instability.
Filings slightly declined in 2021–2022, stabilizing around 55–57 billion, before resuming an upward climb. By 2025, bankruptcies are projected to reach 65 billion, signaling ongoing financial challenges despite temporary relief periods.
This trend underscores how economic downturns, policy shifts, and restructuring strategies continue to shape U.S. bankruptcy dynamics, with a clear movement towards higher filings in the mid-2020s.


