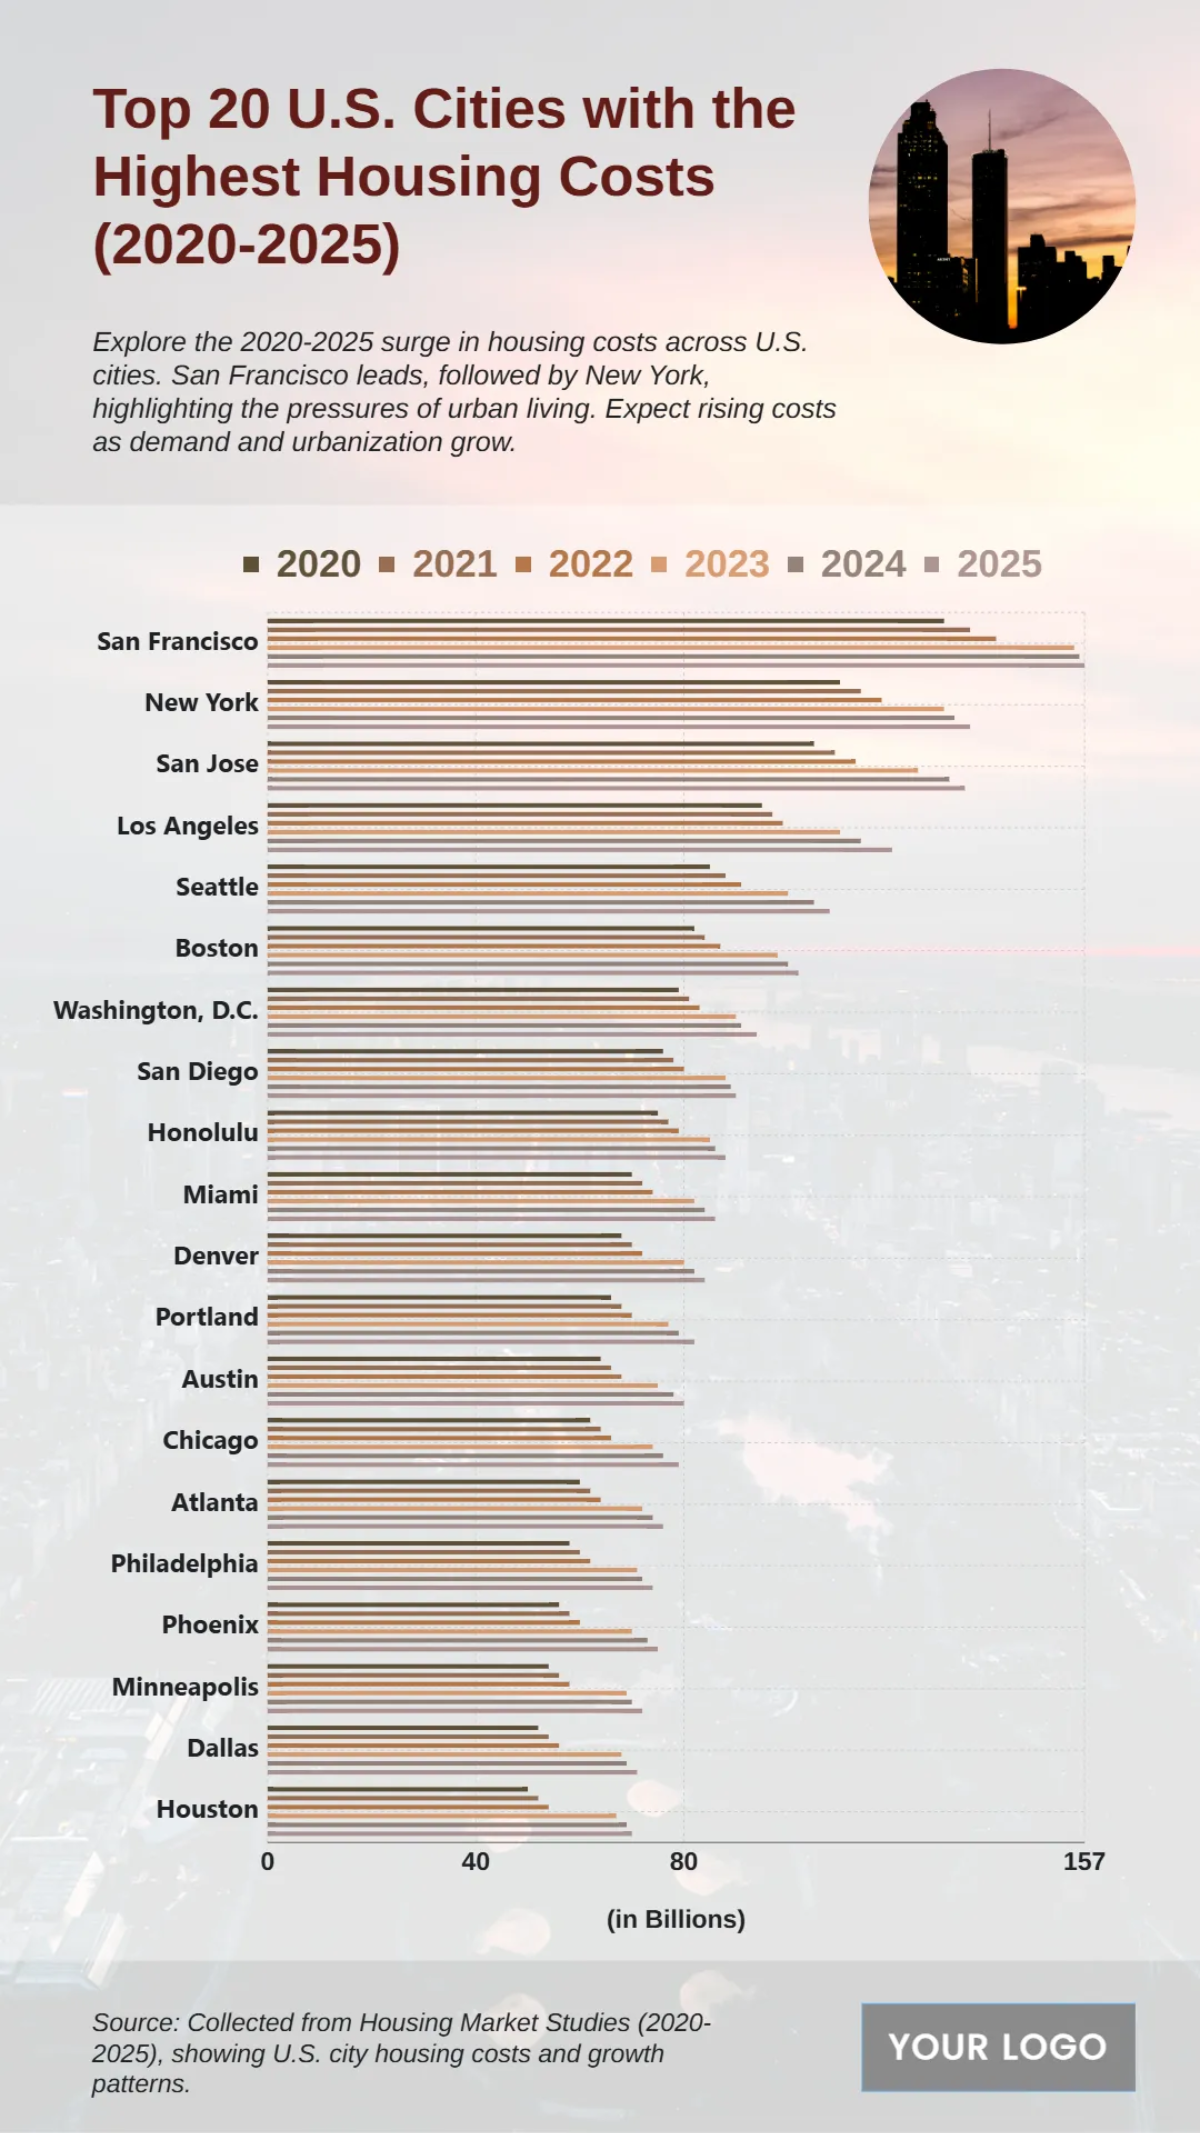
Free Top 20 U.S. Cities with the Highest Housing Costs (2020-2025) Chart
This chart details the top 20 U.S. cities by housing costs, presenting annual data from 2020 with projections through 2025. The data establishes San Francisco as the nation's most expensive market, with total costs rising from approximately $135 billion in 2020 to a projected $157 billion by 2025. Following closely is a top tier of major metropolitan areas, including New York, with costs expected to climb to $145 billion, and fellow California cities San Jose and Los Angeles, projected to reach $130 billion and $125 billion respectively. A consistent pattern of significant year-over-year growth is evident across the entire list, from other major hubs like Seattle and Boston down to cities such as Austin and Dallas. Ultimately, the chart illustrates a widespread and unabating surge in urban housing costs, underscoring a critical trend of growing economic pressure in the nation's key metropolitan centers.


