Free Top 10 U.S. Foreign Direct Investment Inflows by Region (2015-2025) Chart
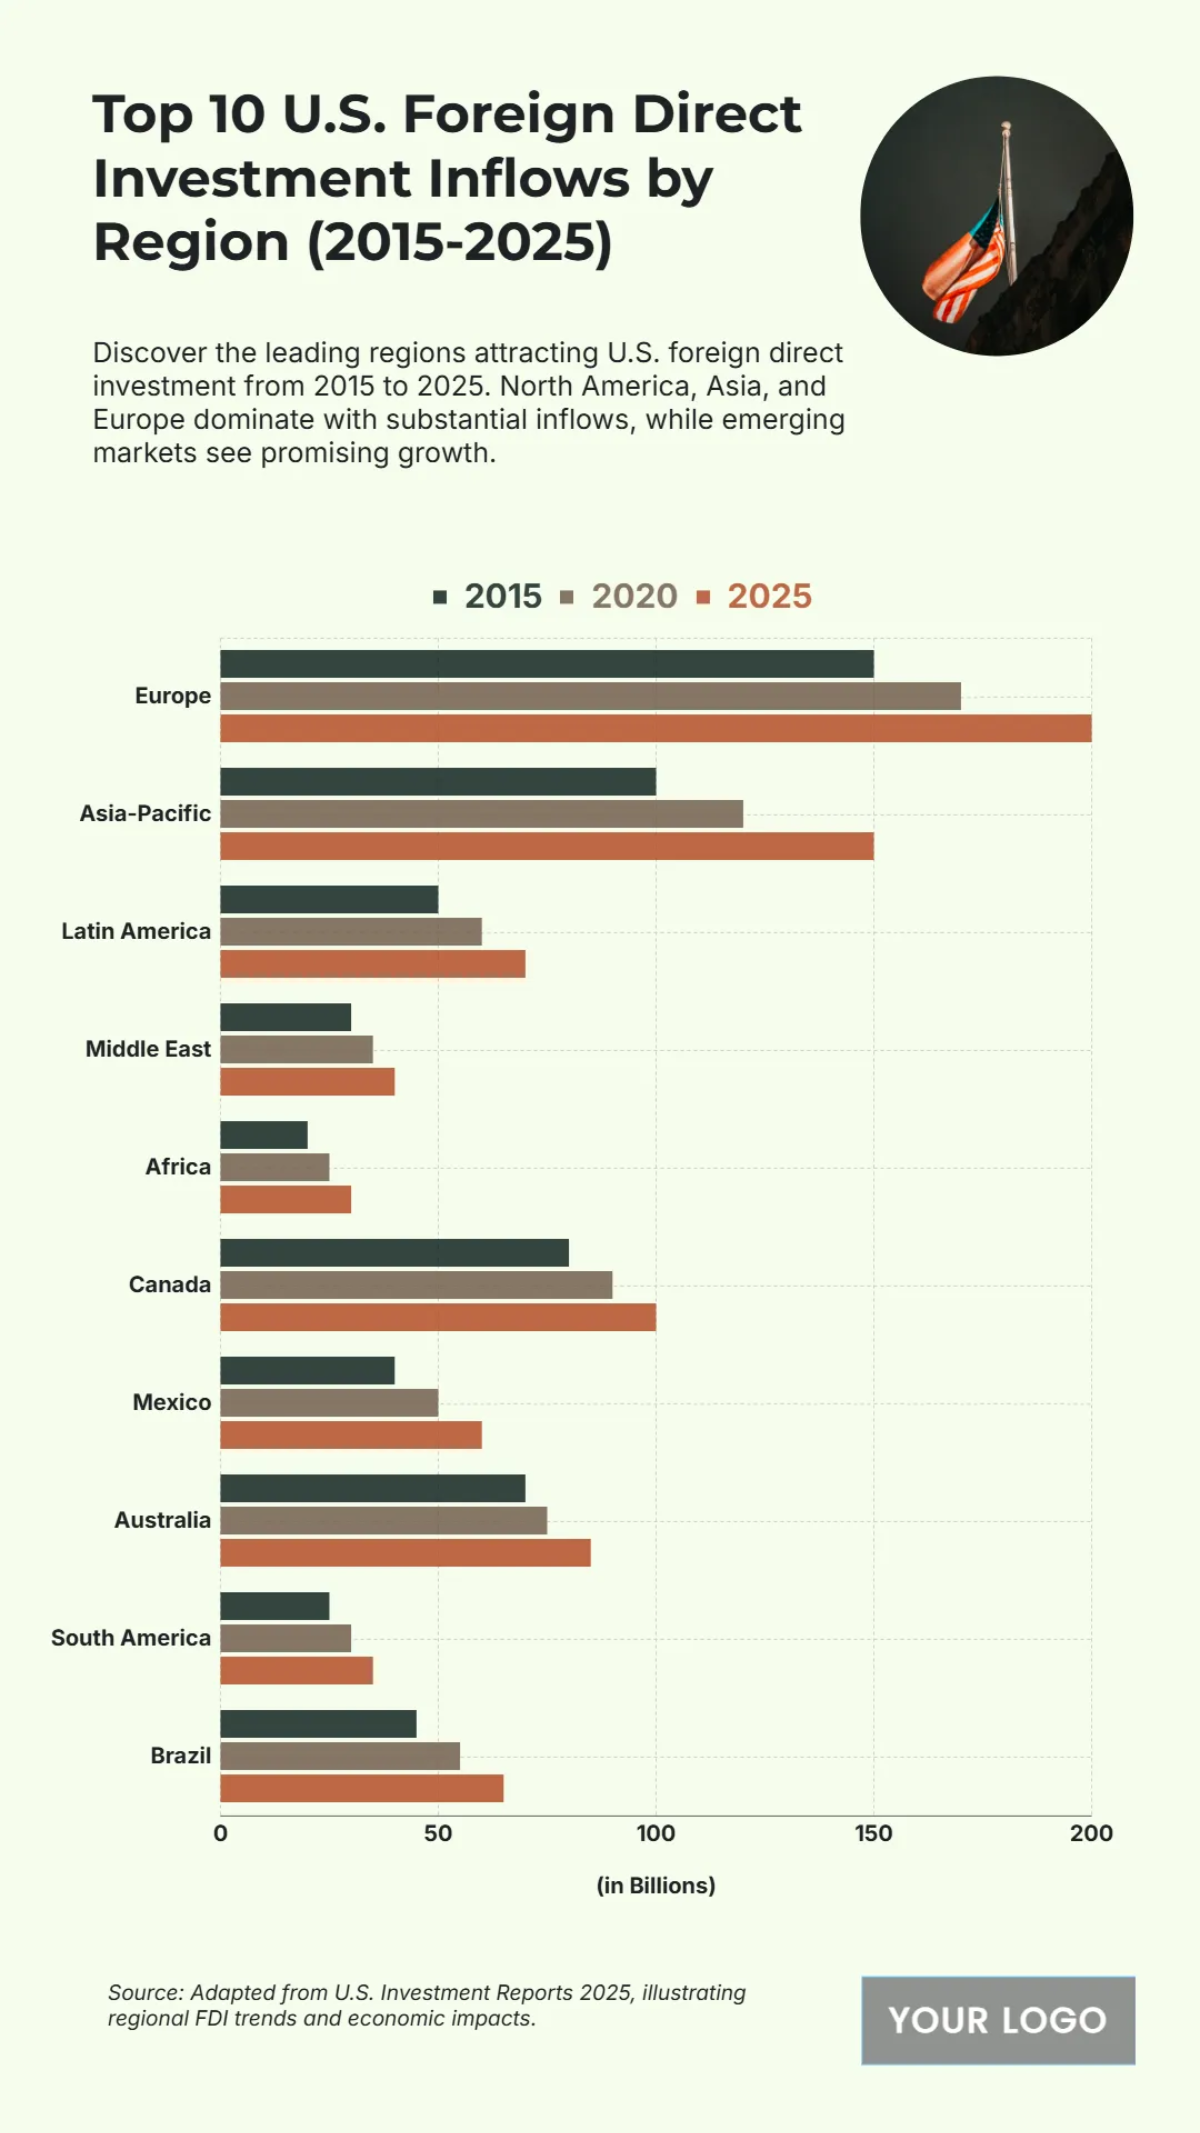
This chart illustrates the top regions for U.S. Foreign Direct Investment (FDI) inflows, detailing amounts in billions for 2015, 2020, and projections for 2025. The data identifies Europe as the principal destination for U.S. investment, consistently leading the group and projected to attract nearly $200 billion by 2025. The Asia-Pacific region follows as a dynamic second, exhibiting the most significant growth with inflows expected to surge from approximately $100 billion in 2015 to over $150 billion by 2025. A strong secondary tier of investment partners includes Canada and Australia, with projected inflows of approximately $105 billion and $90 billion respectively. Further down the ranking, regions in the Americas such as Latin America (projected at $65 billion), Mexico (projected at $60 billion), and Brazil (projected at $55 billion) demonstrate substantial and growing investment. The chart is completed by emerging regions like the Middle East, Africa, and South America, which all show a clear upward trend from a smaller base. Overall, the data indicates a widespread and robust expansion of U.S. foreign investment across both established and developing global markets.


