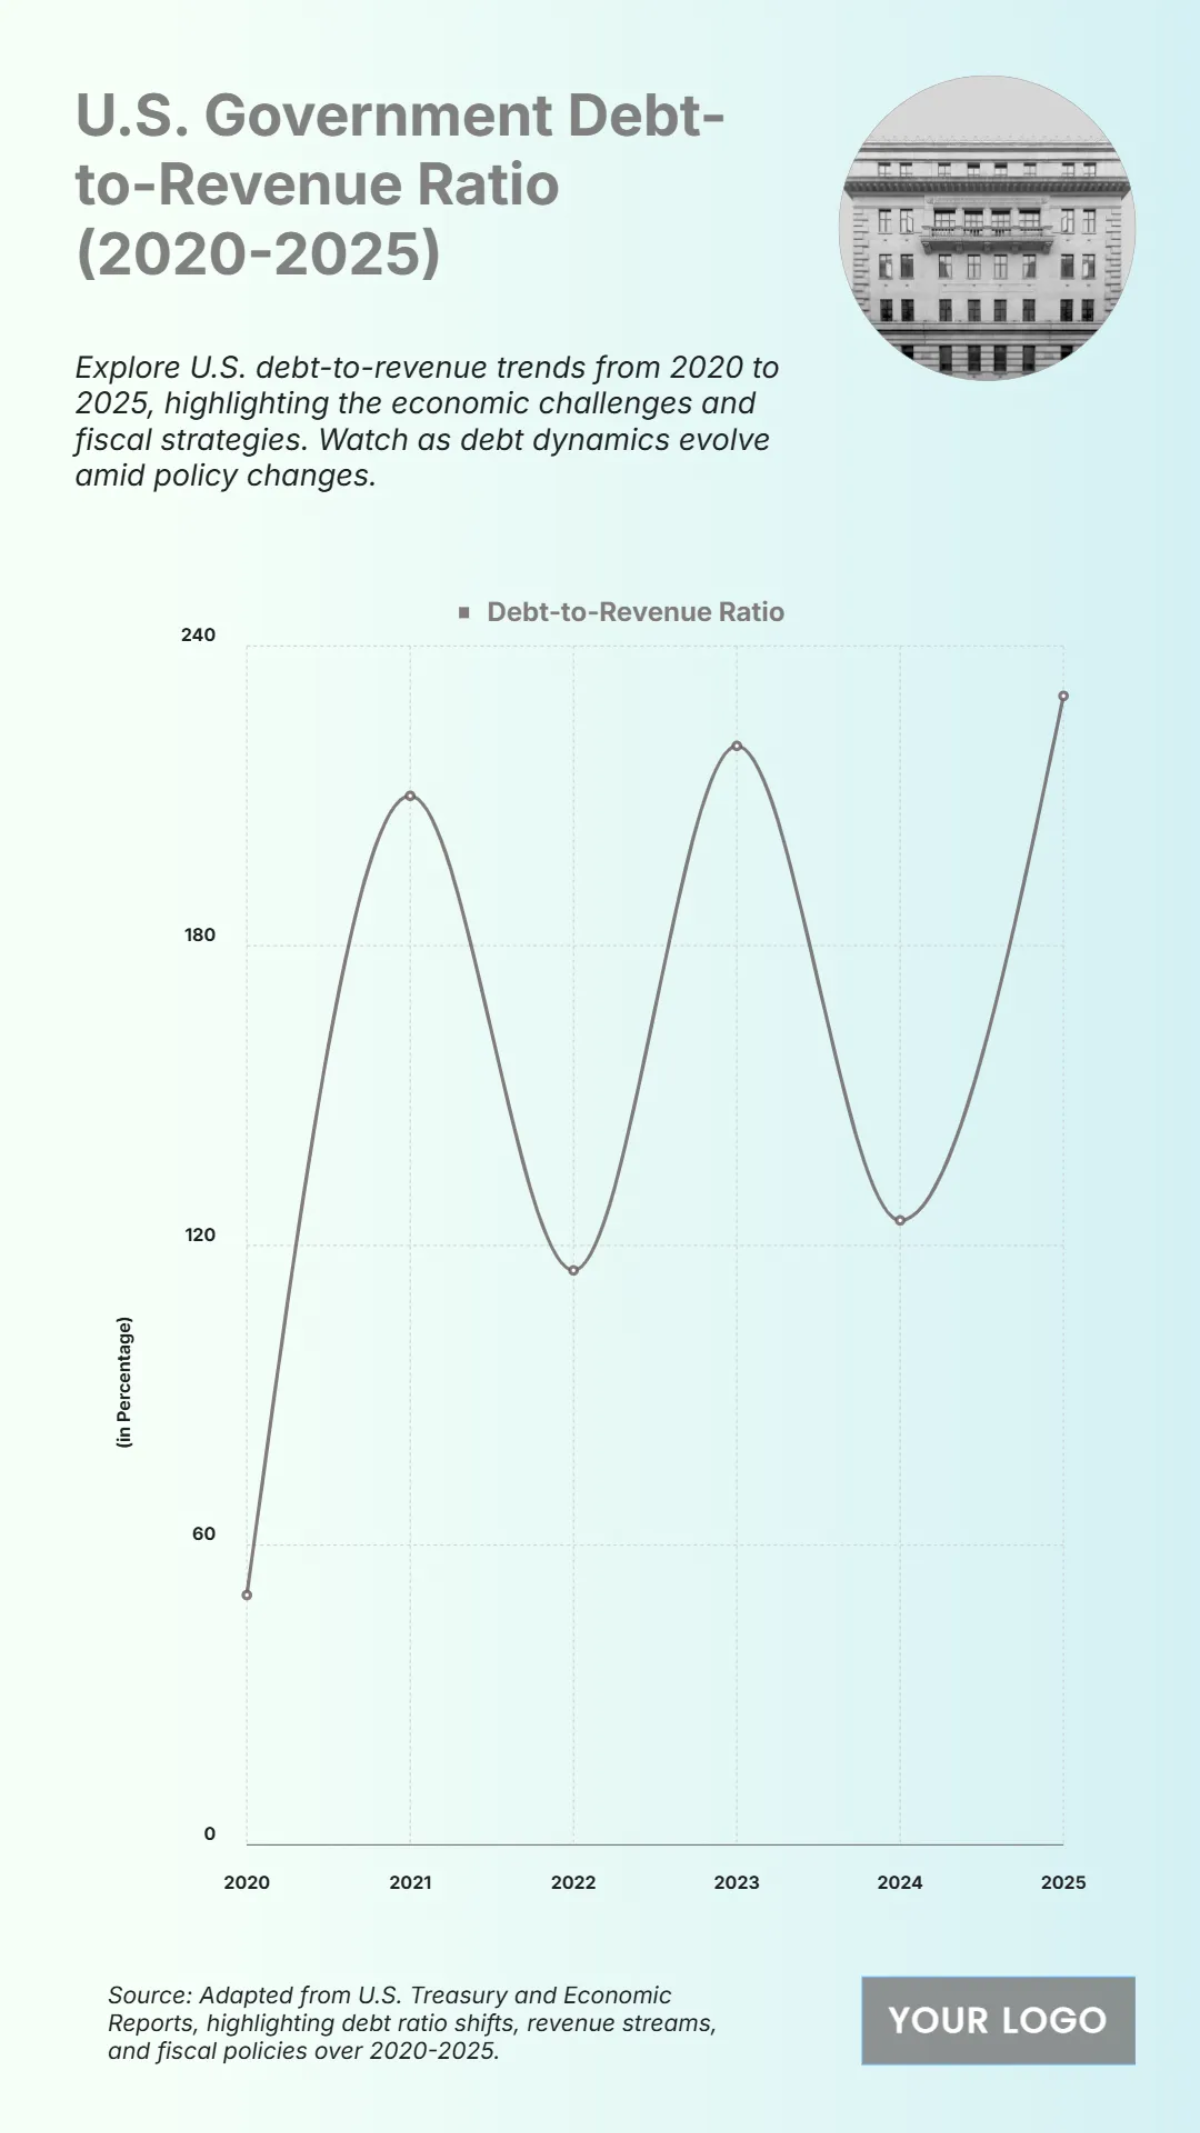
Free U.S. Government Debt-to-Revenue Ratio (2020-2025) Chart
This chart presents the U.S. Government's debt-to-revenue ratio from 2020 to 2025, illustrating a period of significant fiscal volatility. The ratio begins at approximately 50% in 2020 before experiencing a dramatic surge to a peak of around 210% in 2021. This is followed by a sharp decline in 2022 to a trough of about 115%. The volatility continues with another substantial rise to a second peak near 220% in 2023, which then recedes to approximately 125% in 2024. The period culminates with a projection for 2025 showing the ratio climbing to its highest point in the observed timeframe, around 230%. The data underscores a dynamic of extreme fluctuations rather than a steady trend, highlighting a challenging and rapidly evolving economic landscape for the U.S. government during these years.


