Free Top 5 U.S. Nonprofit Sector Revenue Categories (2020-2025) Chart
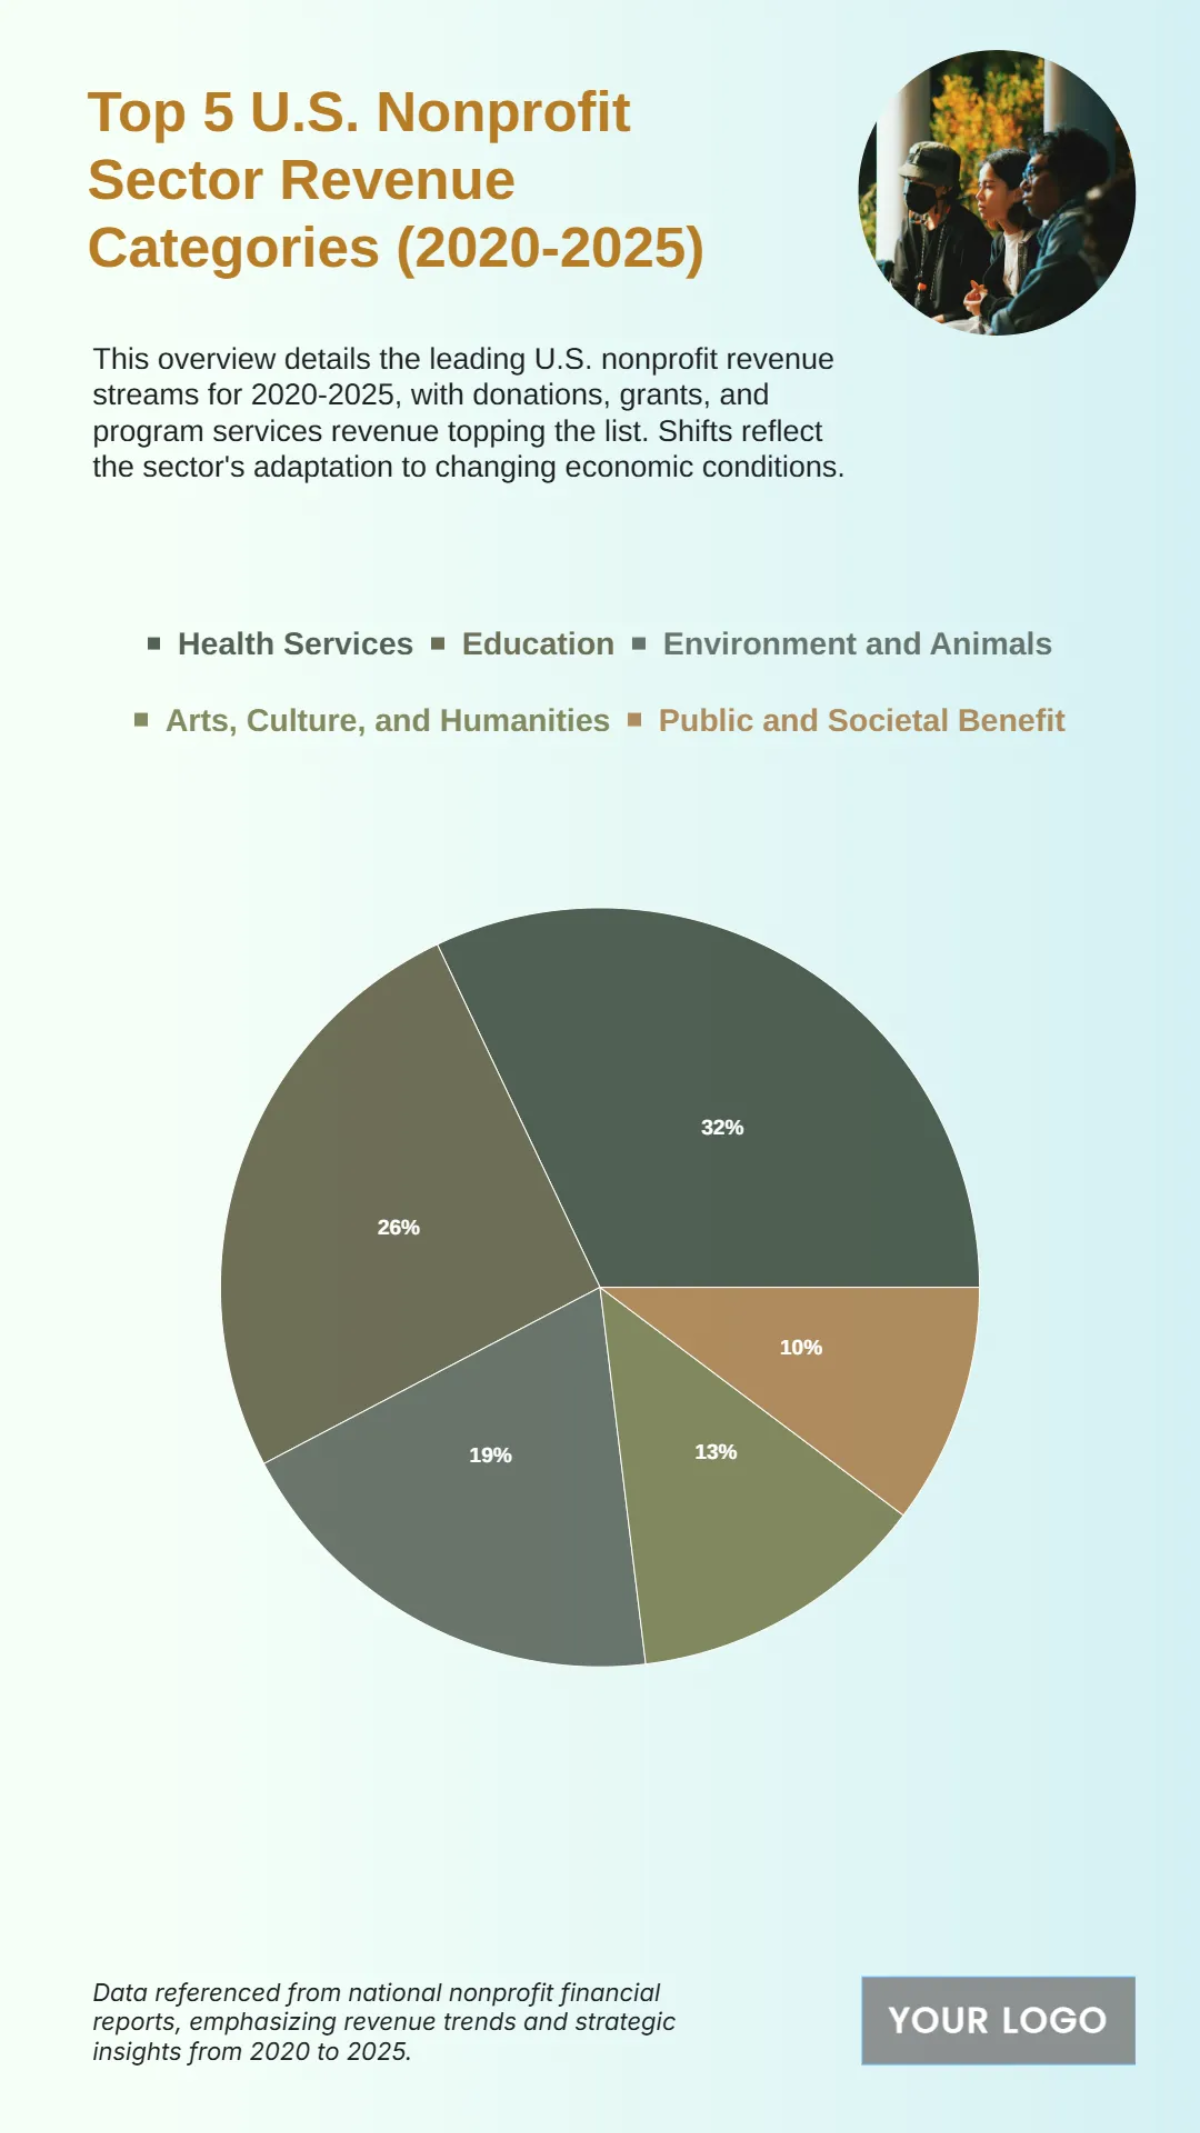
The chart illustrates the distribution of revenue streams across the U.S. nonprofit sector from 2020 to 2025. Health Services leads with 32% of total sector revenue, reflecting the growing importance of medical and wellness programs. Education follows at 26%, supported by sustained investments in schools, universities, and training initiatives. Environment and Animals contribute 19%, highlighting rising public interest in sustainability and conservation. Arts, Culture, and Humanities account for 13%, while Public and Societal Benefit organizations represent the remaining 10%.
This breakdown underscores how nonprofits channel resources into core social needs, with health and education dominating funding priorities, while cultural and environmental initiatives maintain steady support.


