Free Top 5 U.S. Airline Industry Revenue by Carrier (2015-2025) Chart
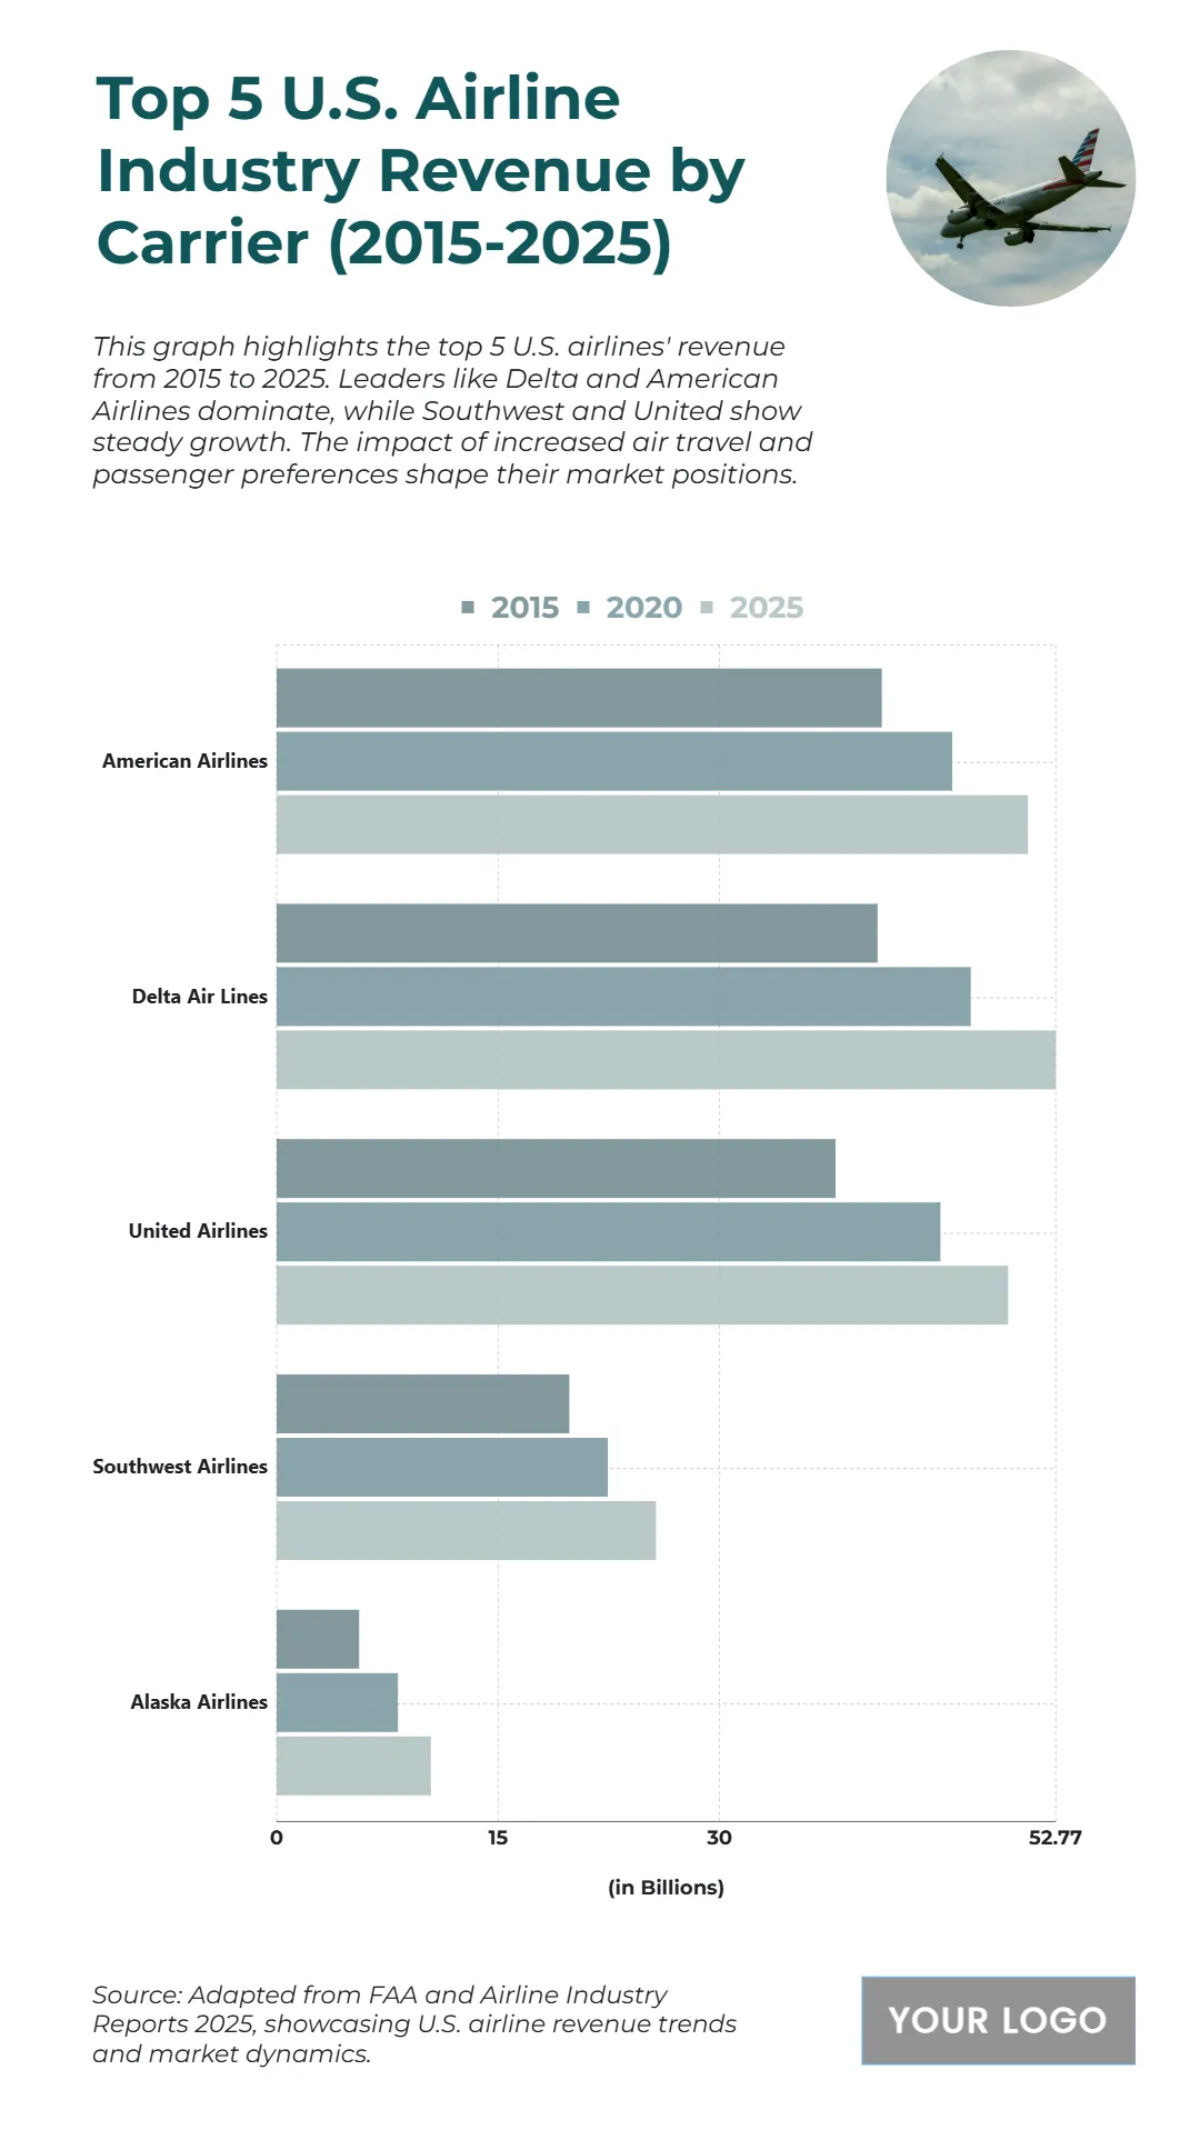
Based on the bar chart titled "Top 5 U.S. Airline Industry Revenue by Carrier (2015-2025)", a clear trend of revenue growth is evident across the major U.S. airlines. The data, presented in billions, shows the top five carriers' revenue in three specific years: 2015, 2020, and 2025. American Airlines consistently leads, with revenue increasing from approximately 42 billion in 2015 to a projected 52.77 billion by 2025. Delta Air Lines and United Airlines are also major players, both demonstrating strong growth. Delta's revenue is projected to be just under 52 billion in 2025, while United's is expected to be slightly higher, at around 50 billion. Both Southwest Airlines and Alaska Airlines show significant growth, albeit at a lower scale. Southwest's revenue is projected to be around 25 billion in 2025, while Alaska Airlines is expected to reach approximately 15 billion. This upward trajectory across all carriers highlights the overall expansion and recovery of the U.S. airline industry, reflecting increased air travel and evolving passenger preferences. The chart provides a comprehensive overview of the revenue dynamics and market positions of these key carriers over the decade.


