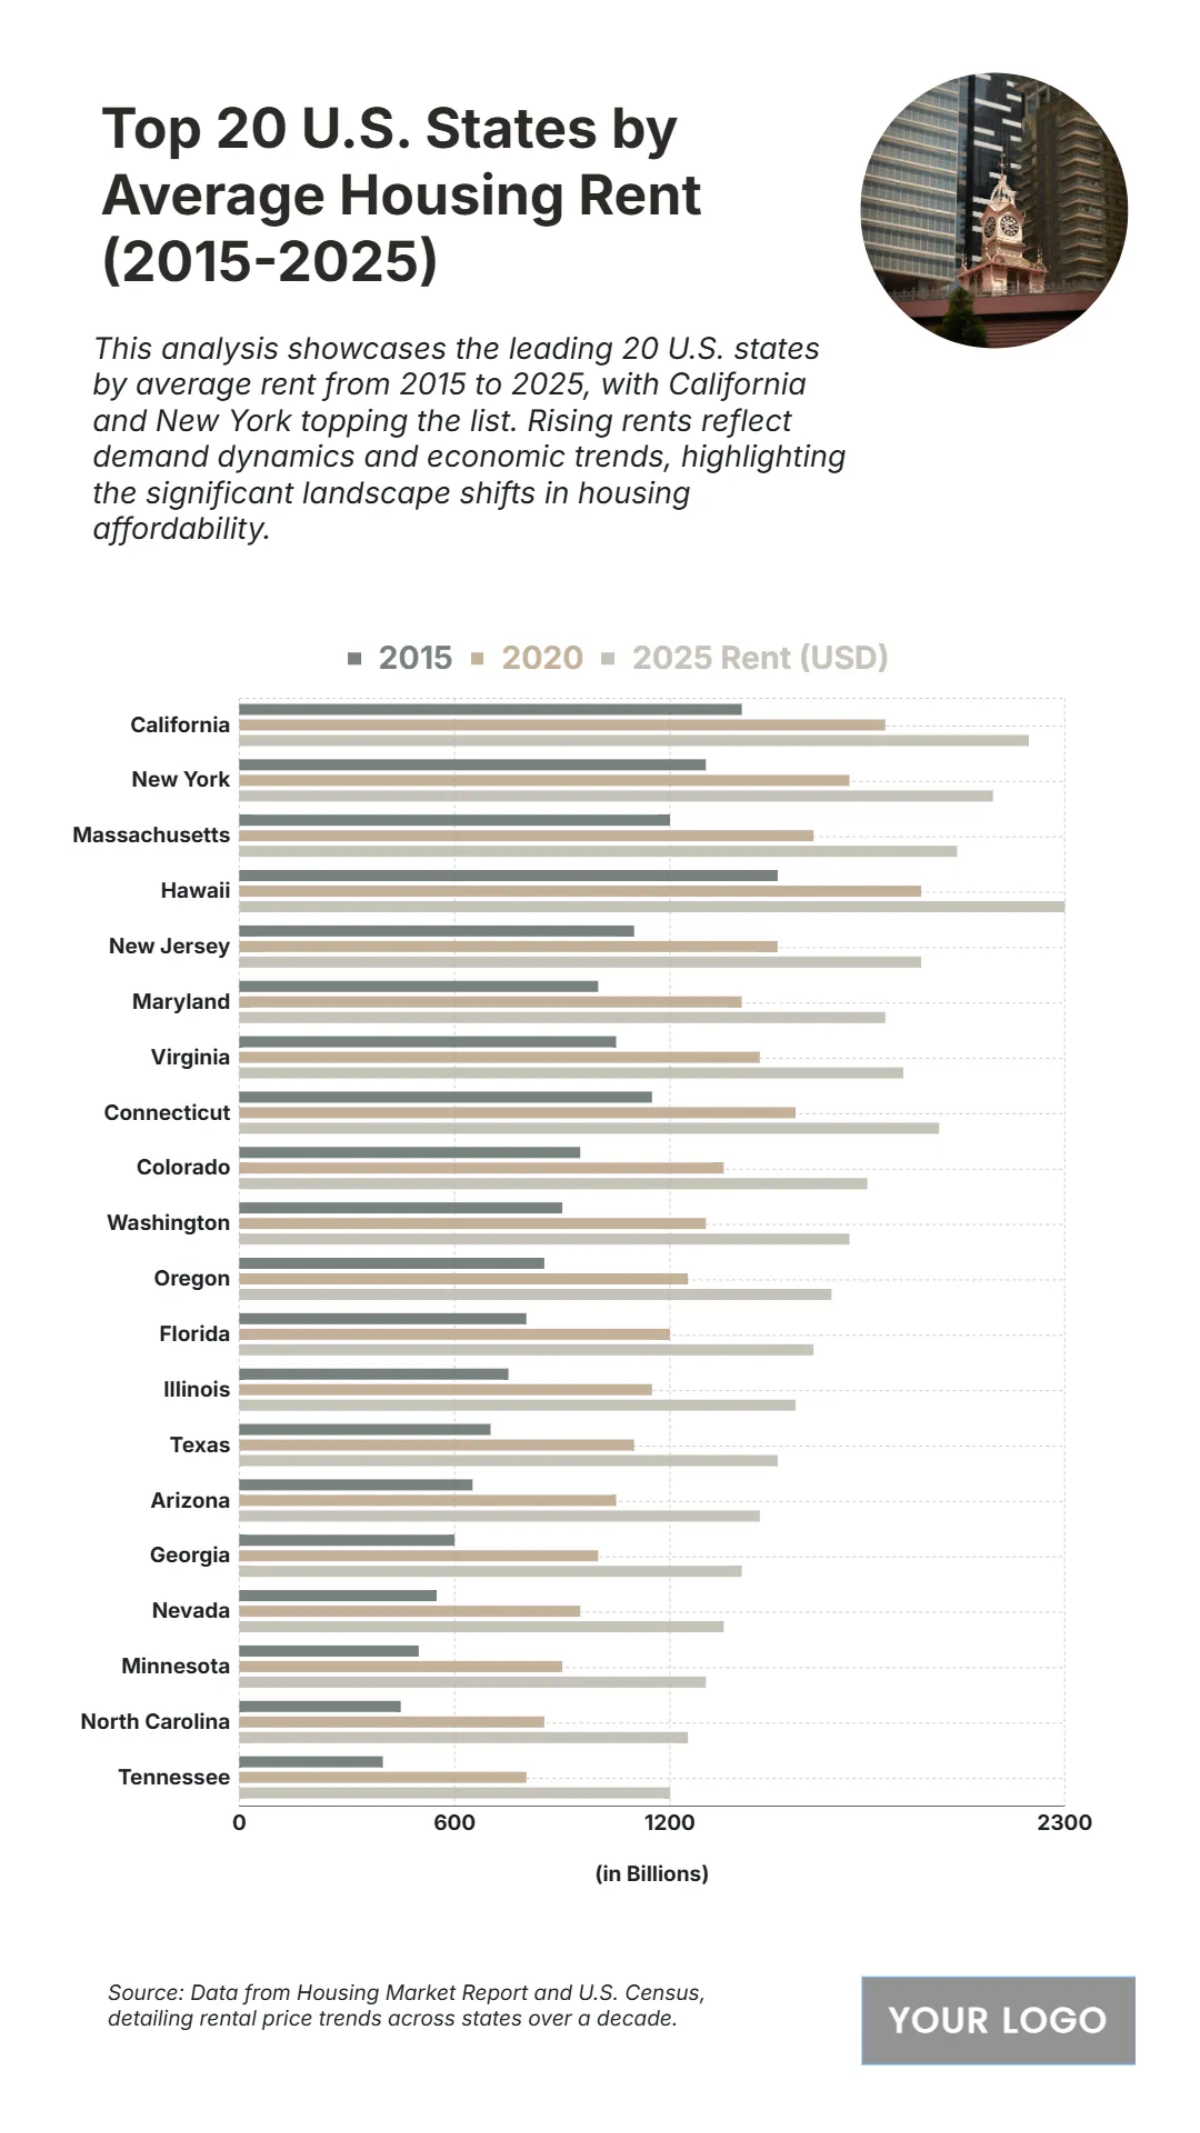
Free Top 20 U.S. States by Average Housing Rent (2015-2025) Chart
Based on the bar chart titled "Top 20 U.S. States by Average Housing Rent (2015-2025)", a clear trend of increasing average housing rent is shown across the leading U.S. states over a decade. The data, presented in USD, highlights the most expensive rental markets. California consistently leads the list, with an average rent that has risen to approximately 2,200 USD in 2025. New York holds the second position, with its average rent also showing significant growth, reaching an estimated 2,100 USD in 2025. Massachusetts and Hawaii also feature prominently, with their average rents approaching 1,900 USD and 1,800 USD respectively by 2025. Even states with lower average rents, such as Tennessee and North Carolina, showed notable increases, with their rents rising from approximately 500 USD in 2015 to between 800 USD and 900 USD by 2025. This widespread increase in rental costs across the country reflects significant economic trends and highlights the growing challenge of housing affordability. The chart provides a comprehensive overview of the rental market dynamics over the period.


