Free Top 10 U.S. States by Oil Production (2020-2025) Chart

- 100% Customizable, free editor
- Access 1 Million+ Templates, photo’s & graphics
- Download or share as a template
- Click and replace photos, graphics, text, backgrounds
- Resize, crop, AI write & more
- Access advanced editor
AI AI Chart and Graph Generator
Generate my free AI Chart and Graph Text or voice to generate a free AI Chart and Graph
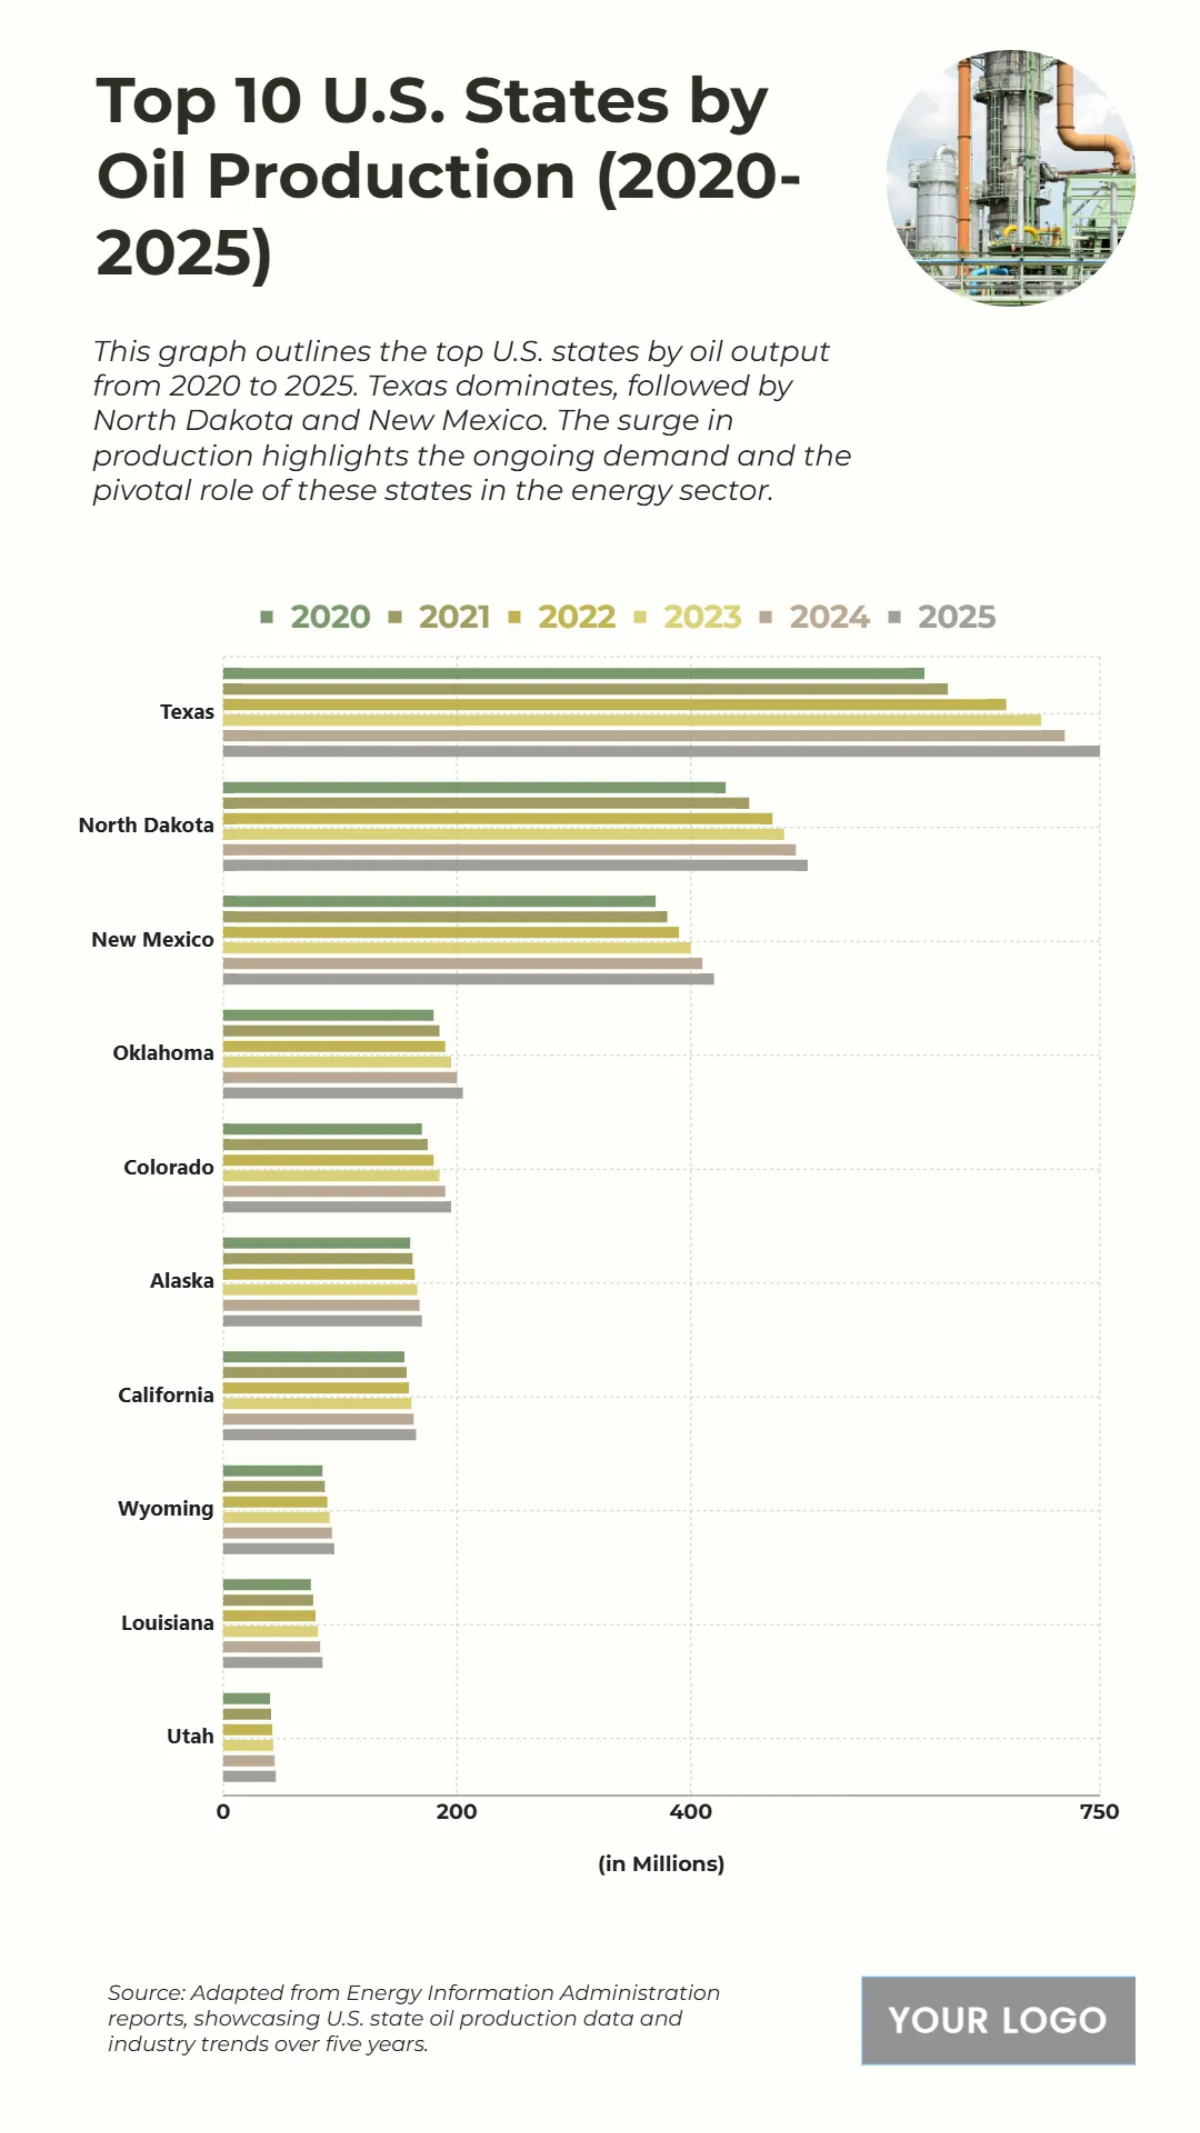
The chart provides a clear overview of the top 10 U.S. states by oil production from 2020 to 2025, revealing a general upward trend. Texas dominates the market, with production starting around 650 million barrels in 2020 and rising to a projected 750 million by 2025. Following closely, North Dakota's output increases from roughly 500 million to 600 million over the period. New Mexico also shows strong growth, with production climbing from approximately 400 million to 450 million by 2025. This data highlights the significant and growing role these states play in meeting the nation's energy demands.
You may also like
- Bar Graph Chart
- Line Graph Chart
- Pie Graph Chart
- Table Graph Chart
- Scatter Graph Chart
- Area Graph Chart
- Tree Graph Chart
- Birth Chart
- Chore Chart
- Time Table Chart
- Dress Size Chart
- Football Depth Chart
- Color Chart
- Color Wheel Chart
- Color Mix Chart
- Classroom Seating Chart
- Church Organizational Chart
- Hierarchy Organizational Chart
- Tree Organizational Chart
- Organization Chart
- Time Chart
- Blood Pressure Chart
- Behavior Chart
- Process Flowchart
- Process Flow Chart
- Baby Feeding Chart
- BMI Chart
- Ring Size Chart
- Height Chart
- Number Chart
- Food Chart
- Baby Milestones Chart
- Blood Sugar Chart
- Body Temperature Chart
- Diet Chart
- Metric Chart
- Pregnancy Weight Gain Chart
- HCG Levels Chart
- Astrology Chart
- Blood Oxygen Level Chart
- Gauge Chart
- Sales Chart
- Marketing Chart
- Military Time Chart
- Pregnancy Food Chart
- Medical Chart
- Wedding Seating Chart
- Guitar Chord Chart
- Pedigree Chart
- Natal Chart
- Team Organizational Chart
- Feelings Chart
- Piano Chord Chart
- Shoe Size Chart
- Activity Chart
- Height Weight
- Eye Chart
- Chakra Chart
- Reflexology Chart
- Hospital Organizational Chart
- Radar Chart
- College Organizational Chart
- Column Chart
- Roman Numerals Chart
- Weather Chart
- Height Conversion Chart
- Food Calorie Chart
- Fundraising Chart
- Kids Chore Chart
- Donut Chart
- Incident Flow Chart
- Patient Chart
- Body Measurement Chart
- Synastry Chart
- Funnel Chart
- Goal Chart
- Weight Loss Chart
- Money Chart
- Research FlowChart
- Medical Organizational Chart
- Protein Chart
- Retail Organizational Chart
- Sports Organizational Chart
- Vitamin Chart
- Research Gantt Chart
- To Do Chart
- Tooth Chart
- Conjugation Chart
- Drug Chart
- Event FlowChart
- Gildan Size Chart
- Logistics Organizational Chart
- Production FlowChart
- Bank Organizational Chart
- Dental Chart
- Dissertation Gantt Chart
- Training Gantt Chart
- Warehouse Organizational Chart
- Army Weight Chart
- Communication FlowChart
- Face Chart
- Pharma Organizational Chart
- Travel Gantt Chart
- Gaming FlowChart
- Insurance Organizational Chart
- Manufacturing Chart
- Progress Chart
- Travel Organizational Chart
- Charity FlowChart
- Design Firm/Company Organizational Chart
- Hospital Gantt Chart
- Manufacturing Gantt Chart
- Recruitment Gantt Chart
- Website Gantt Chart
- Environment Organizational Chart
- Fire Organizational Chart


