Free U.S. Retail Bankruptcy Trends (2015-2025) Chart
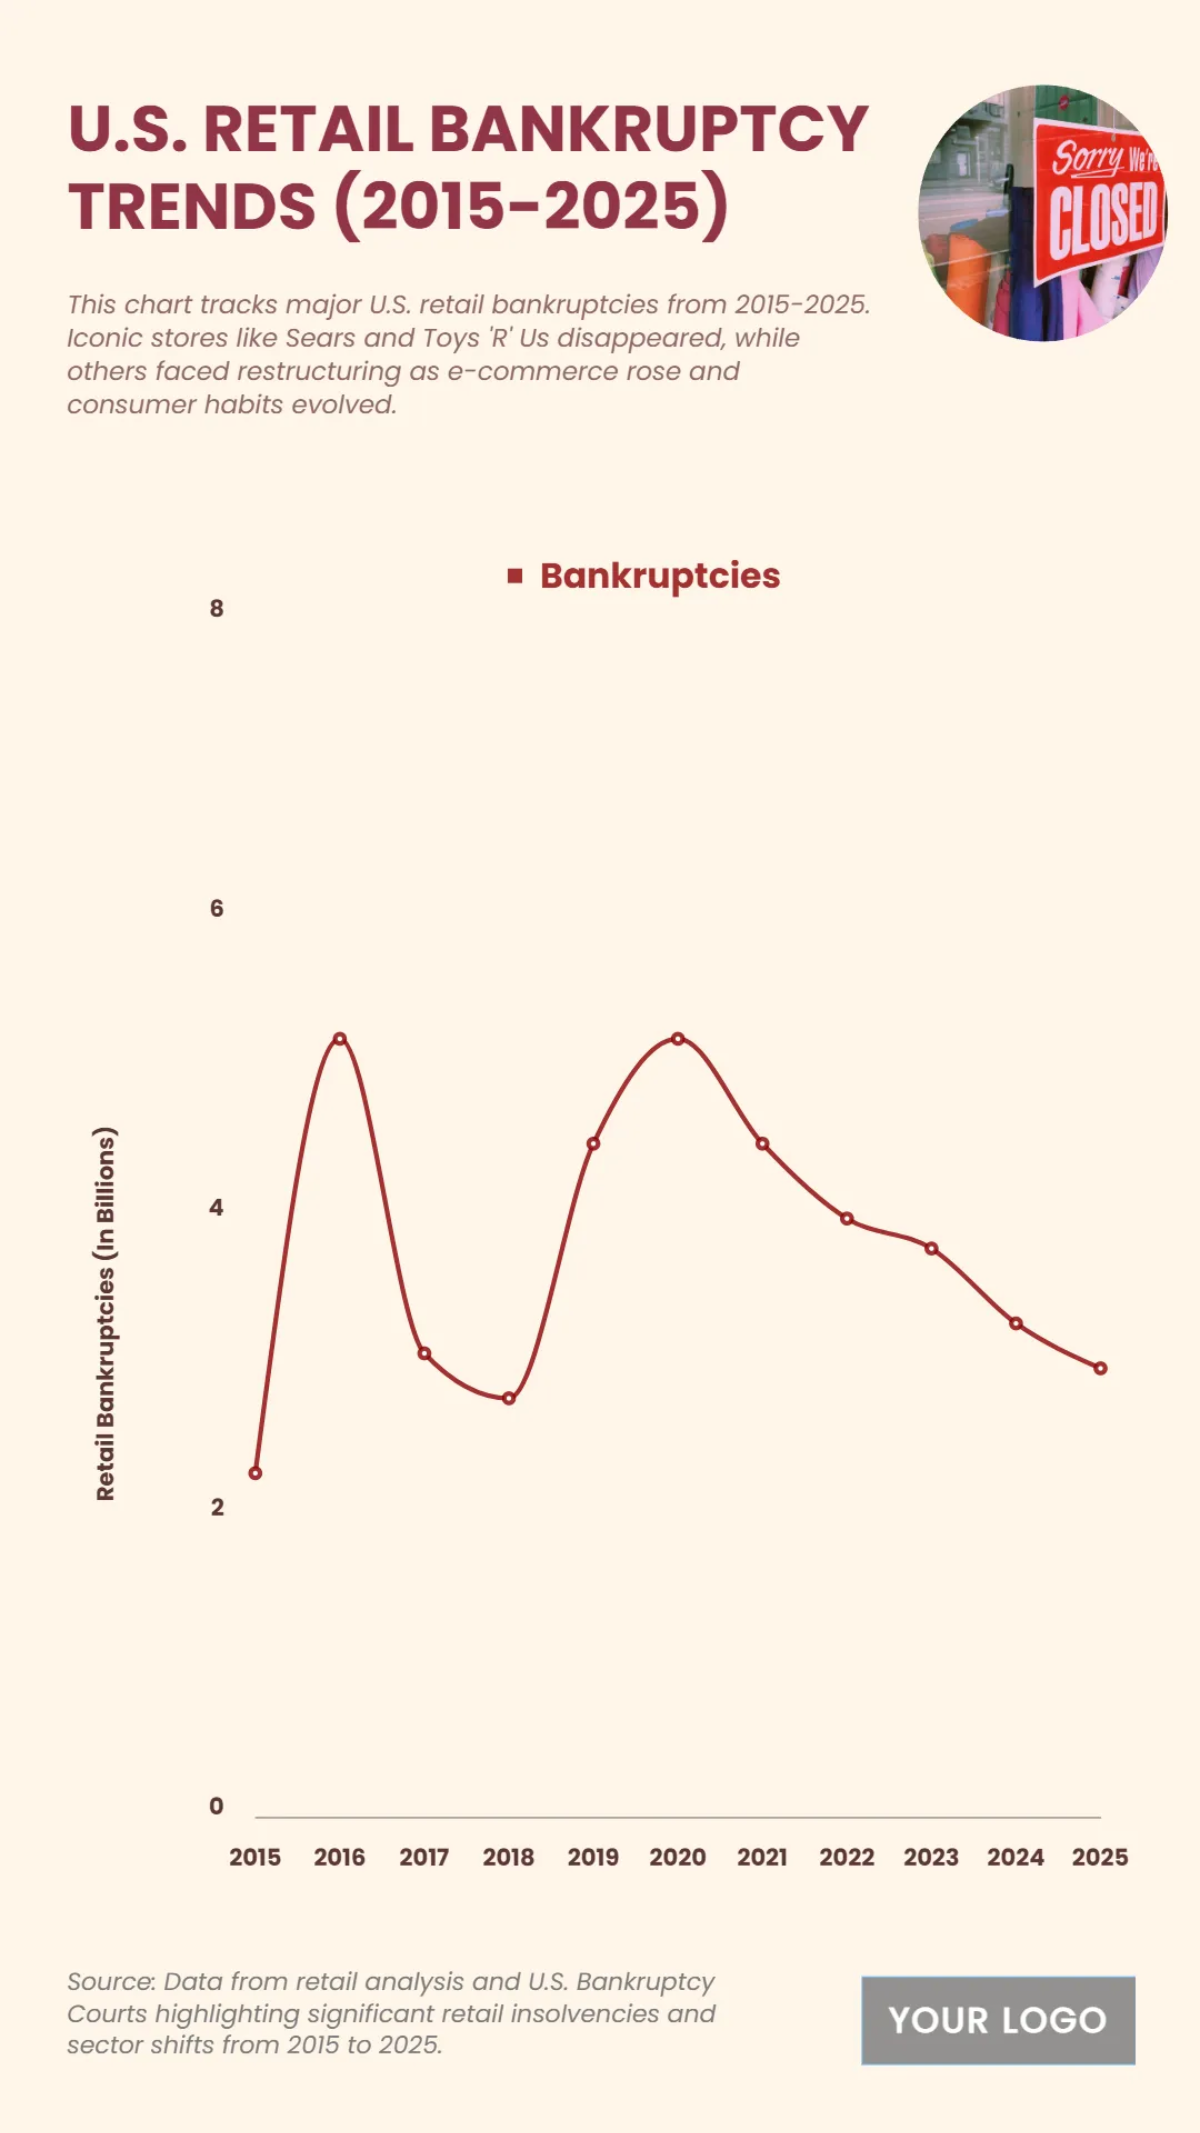
The chart provides an overview of U.S. retail bankruptcy trends from 2015 to 2025, revealing a volatile pattern that ends in a significant decline. Retail bankruptcies peaked at around 50 million in both 2016 and 2018, followed by a smaller peak around 45 million in 2020. This was followed by a sharp and consistent decline in bankruptcies, demonstrating a strong recovery in the retail sector. The trend is projected to reach its lowest point on the chart in 2025 at approximately 10 million bankruptcies, underscoring the industry's adaptation and stabilization after years of fluctuating economic challenges.
| Labels | Bankruptcies |
|---|---|
| 2015 | 2.3 |
| 2016 | 5.2 |
| 2017 | 3.1 |
| 2018 | 2.8 |
| 2019 | 4.5 |
| 2020 | 5.2 |
| 2021 | 4.5 |
| 2022 | 4.0 |
| 2023 | 3.8 |
| 2024 | 3.3 |
| 2025 | 3.0 |


