Free U.S. Venture Capital Exits by Year (2015-2025) Chart
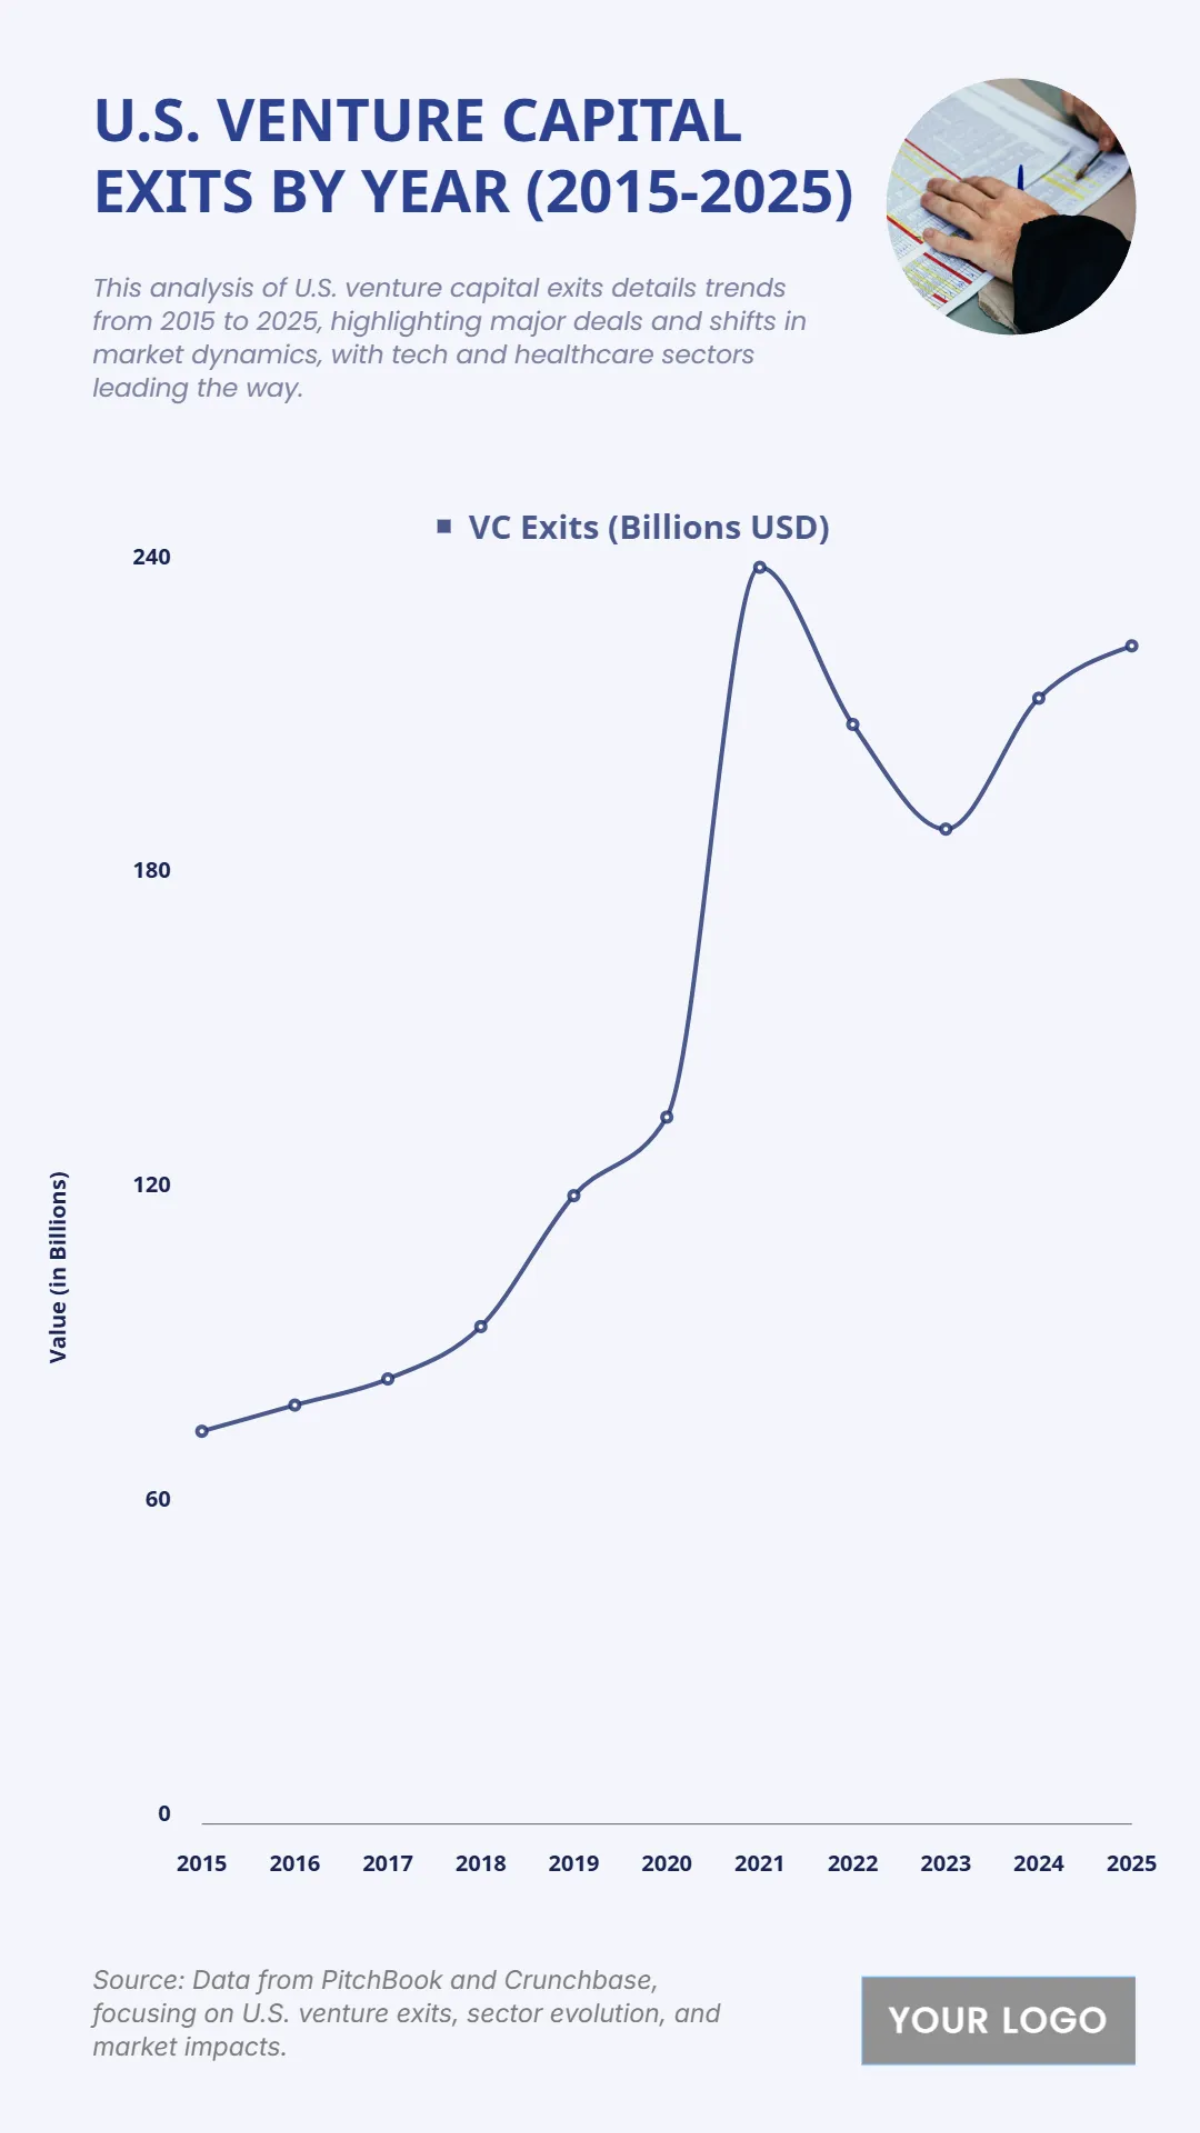
The chart provides an overview of U.S. venture capital exits from 2015 to 2025, revealing a volatile trend with a notable peak. The value of exits grew steadily from roughly $65 billion in 2015 to $130 billion in 2020. However, this was followed by a dramatic surge to a peak of approximately $200 billion in 2021. After this unprecedented high, the value of exits experienced a correction, dropping to $165 billion in 2023. The trend shows a projected recovery, with the value of exits expected to reach around $195 billion in 2025.
| Labels | VC Exits (Billions USD) |
|---|---|
| 2015 | 75 |
| 2016 | 80 |
| 2017 | 85 |
| 2018 | 95 |
| 2019 | 120 |
| 2020 | 135 |
| 2021 | 240 |
| 2022 | 210 |
| 2023 | 190 |
| 2024 | 215 |
| 2025 | 225 |


